Home
2024
Election Results
Election Info
Weblog
Forum
Wiki
Search
Email
Login
Site Info
Store
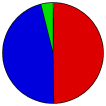
2018 Gubernatorial General Election Results
Note: The Google advertisement links below may advocate political positions that this site does not endorse.
Unofficial Results
Gubernatorial
Candidate
Lt. Gubernatorial
Candidate
Political
Party
Popular Vote
Ned Lamont
Susan Bysiewicz
Democratic
694,510
49.37%
Bob Stefanowski
Joe Markley
Republican
650,138
46.21%
Oz Griebel
Monte E. Frank
Griebel Frank for CT
54,741
3.89%
Rodney Hanscomb
Jeffrey Thibeault
Libertarian
6,086
0.43%
Other (
+
)
-
-
1,328
0.09%
Map Key
> 40%
> 50%
> 60%
> 70%
Turnout
Maps
Election Data and Statistics:
County Data (Table)
(m)
County Data (Graphs)
City and Town Data
(m)
Voter Registration & Turnout Data
(m)
Purchase Detailed Data
Compare State Data by Year (Table)
Compare State Data by Year (Graphs)
View All 2018 Connecticut Data
Compare State Maps by Year
View All 2018 Connecticut Maps
Election Tools
Atlas Forum
Image Code for Maps:
County
,
Town
,
Pop
,
Tnd
,
Swg
Data Sources:
Source for Popular Vote data: State of Connecticut Secretary of State.
November 2018 State Election
, State of Connecticut Secretary of State (https://ctemspublic.pcctg.net/#/races) (accessed 19 Dec 2018)
Source for Population data: U.S. Census Bureau.
Results for and Individual County:
Fairfield County
Hartford County
Litchfield County
Middlesex County
New Haven County
New London County
Tolland County
Windham County
The 2018 Campaign:
Pre-Election Polls
< 2014
Choose Year
2022
2014
2010
2006
2002
1998
1994
1990
1986
1982
1978
1974
1970
1966
1962
1958
1954
1950
1938
1934
1932
1930
1928
1926
1924
1922
1912
Choose Office
Senator
Secretary of State
State Treasurer
Attorney General
Comptroller General
Choose State
Alabama
Alaska
Arizona
Arkansas
California
Colorado
Florida
Georgia
Hawaii
Idaho
Illinois
Iowa
Kansas
Maine
Maryland
Massachusetts
Michigan
Minnesota
Nebraska
Nevada
New Hampshire
New Mexico
New York
Ohio
Oklahoma
Oregon
Pennsylvania
Rhode Island
South Carolina
South Dakota
Tennessee
Texas
Vermont
Wisconsin
Wyoming
2022 >
Connecticut Election Results Home
-
National Results for 2018
-
Use Frame Navigation
View Large Map Page for This Contest
Login
Terms of Use
-
DCMA Policy
-
Privacy Policy and Cookies
©
Dave Leip's Atlas of U.S. Elections, LLC 2019 All Rights Reserved


