Home
2024
Election Results
Election Info
Weblog
Forum
Wiki
Search
Email
Login
Site Info
Store
2018 Senatorial General Election Results
Note: The Google advertisement links below may advocate political positions that this site does not endorse.
Unofficial Results
Senatorial
Candidate
Political
Party
Popular Vote
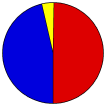
Joseph Manchin, III
Democratic
290,510
49.57%
Patrick Morrisey
Republican
271,113
46.26%
Rusty Hollen
Libertarian
24,411
4.17%
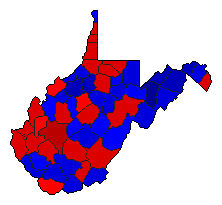
Map Key
> 40%
> 50%
> 60%
> 70%
Turnout
Maps
Election Data and Statistics:
County Data (Table)
(m)
County Data (Graphs)
Congressional District Data
(m)
Purchase Detailed Data
Compare State Data by Year (Table)
Compare State Data by Year (Graphs)
View All 2018 West Virginia Data
Compare State Maps by Year
View All 2018 West Virginia Maps
Election Tools
Atlas Forum
Image Code for Maps:
County
,
CD
,
Pop
,
Tnd
,
Swg
Data Sources:
Source for Popular Vote data: West Virginia Secretary of State.
November 6, 2018 General Election Unofficial Results
, West Virginia Secretary of State (http://results.enr.clarityelections.com/WV/92360/) (accessed 15 Jan 2019)
Source for Population data: U.S. Census Bureau.
Results for and Individual County:
Barbour County
Berkeley County
Boone County
Braxton County
Brooke County
Cabell County
Calhoun County
Clay County
Doddridge County
Fayette County
Gilmer County
Grant County
Greenbrier County
Hampshire County
Hancock County
Hardy County
Harrison County
Jackson County
Jefferson County
Kanawha County
Lewis County
Lincoln County
Logan County
McDowell County
Marion County
Marshall County
Mason County
Mercer County
Mineral County
Mingo County
Monongalia County
Monroe County
Morgan County
Nicholas County
Ohio County
Pendleton County
Pleasants County
Pocahontas County
Preston County
Putnam County
Raleigh County
Randolph County
Ritchie County
Roane County
Summers County
Taylor County
Tucker County
Tyler County
Upshur County
Wayne County
Webster County
Wetzel County
Wirt County
Wood County
Wyoming County
The 2018 Campaign:
Pre-Election Polls
< 2014
Choose Year
2020
2014
2012
2010
2008
2006
2002
2000
1996
1994
1990
1988
1984
1982
1978
1976
1972
1970
1966
1964
1960
1958
1954
1952
Choose Office
Amendment 1
Choose State
Arizona Class 1
California Class 1
Connecticut Class 1
Delaware Class 1
Florida Class 1
Hawaii Class 1
Indiana Class 1
Maine Class 1
Maryland Class 1
Massachusetts Class 1
Michigan Class 1
Minnesota Class 1
Minnesota Class 2
Mississippi Class 1
Mississippi Class 2
Missouri Class 1
Montana Class 1
Nebraska Class 1
Nevada Class 1
New Jersey Class 1
New Mexico Class 1
New York Class 1
North Dakota Class 1
Ohio Class 1
Pennsylvania Class 1
Rhode Island Class 1
Tennessee Class 1
Texas Class 1
Utah Class 1
Vermont Class 1
Virginia Class 1
Washington Class 1
Wisconsin Class 1
Wyoming Class 1
2020 >
West Virginia Election Results Home
-
National Results for 2018
-
Use Frame Navigation
View Large Map Page for This Contest
Login
Terms of Use
-
DCMA Policy
-
Privacy Policy and Cookies
©
Dave Leip's Atlas of U.S. Elections, LLC 2019 All Rights Reserved


