Home
2024
Election Results
Election Info
Weblog
Forum
Wiki
Search
Email
Login
Site Info
Store
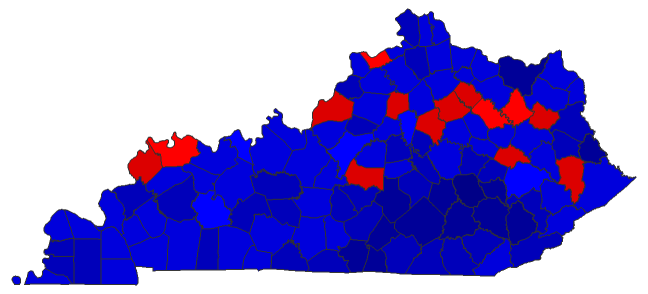
2015 Gubernatorial General Election - Kentucky
Note: The Google advertisement links below may advocate political positions that this site does not endorse.
Choose Office
Official Results
Choose State
Kentucky
Louisiana
Mississippi
Gubernatorial
Candidate
Lt. Gubernatorial
Candidate
Political
Party
Popular Vote
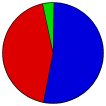
Matt Bevin
Jenean Hampton
Republican
511,374
52.52%
Jack Conway
Sannie Overly
Democratic
426,620
43.81%
Drew Curtis
Heather Curtis
Independent
35,597
3.66%
Other (
+
)
-
-
101
0.01%
Total Vote
973,692
Maps
(Note: click the 'H' buttons above to hold the given map and change the image map)
Per
Democratic
Republican
Pie
>20%
>30%
>40%
>50%
>60%
>70%
>80%
>90%
Election Data and Statistics:
County Data (Table)
(m)
County Data (Graphs)
Purchase Detailed Data
Compare State Data by Year (Table)
Compare State Data by Year (Graphs)
View All 2015 Kentucky Data
Compare State Maps by Year
View All 2015 Kentucky Maps
Data Sources:
Source for Popular Vote data: Kentucky State Board of Elections,
November 3, 2015 Official 2015 General Election Results For the office of Governor and Lieutenant Governor
(Frankfurt, 2015)
< 2011
Choose Year
2023
2019
2011
2019 >
Classic Kentucky Results for 2015
-
National Results for 2015
Login
Terms of Use
-
DCMA Policy
-
Privacy Policy and Cookies
©
Dave Leip's Atlas of U.S. Elections, LLC 2019 All Rights Reserved