Note: The Google advertisement links below may advocate political positions that this site does not endorse.
Official Results
  Senatorial
Candidate
Political
Party
Popular Vote
Elizabeth WarrenDemocratic 1,696,346 53.74%
Scott BrownRepublican 1,458,048 46.19%
Write-ins- 2,159 0.07%
Total Vote 3,156,553
Maps
2012 Senatorial General Election - Massachusetts Election County Map
County H
County Pop H
2006 Button H
Per Vote Democratic Button H
Per Vote Republican Button H
Swing Map Button H
Trend Map Button H
Town H
Last Button H
Per Vote Democratic Button H
Per Vote Republican Button H
Swing Map Button H
Trend Map Button H
 
(Note: click the 'H' buttons above to hold the given map and change the image map)
PerDemocraticRepublicanPie
>20%
 
0
 
 
0
 
pie
>30%
 
0
 
 
0
 
>40%
 
0
 
 
0
 
>50%
 
58
 
 
58
 
>60%
 
53
 
 
53
 
>70%
 
30
 
 
30
 
>80%
 
7
 
 
7
 
>90%
 
0
 
 
0
 
 Election Data and Statistics:
Data Sources:
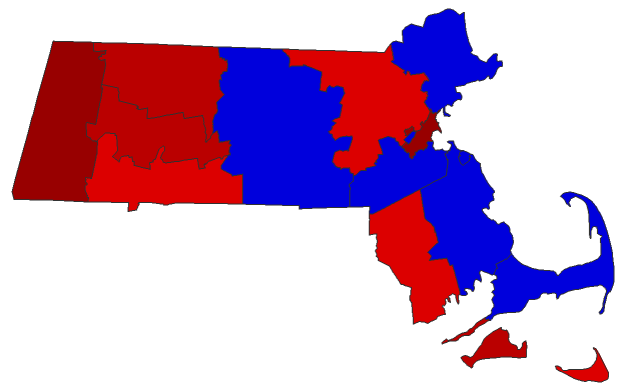
  • Source for Popular Vote data: Massachusetts Secretary of the Commonwealth. Elections Division. PD43+ Massachusetts Election Statistics, Massachusetts Secretary of the Commonwealth. Elections Division (http://ma.electionstats.com/elections/view/22519/ ) (accessed 22 Feb 2013)


Classic Massachusetts Results for 2012 - National Results for 2012

Login

Terms of Use - DCMA Policy - Privacy Policy and Cookies


© Dave Leip's Atlas of U.S. Elections, LLC 2019 All Rights Reserved