Note: The Google advertisement links below may advocate political positions that this site does not endorse.
Official Results
  Senatorial
Candidate
Political
Party
Popular Vote
Debbie StabenowDemocratic 2,735,826 58.80%
Pete HoekstraRepublican 1,767,386 37.98%
Scotty BomanLibertarian 84,480 1.82%
Harley MikkelsonGreen 27,890 0.60%
Richard A. MatkinUS Taxpayers 26,038 0.56%
YOther (+) - 11,298 0.24%
Total Vote 4,652,918
Maps
2012 Senatorial General Election - Michigan Election County Map
County H
County Pop H
2006 Button H
Per Vote Democratic Button H
Per Vote Republican Button H
Swing Map Button H
Trend Map Button H
 
(Note: click the 'H' buttons above to hold the given map and change the image map)
PerDemocraticRepublicanPie
>20%


pie
>30%


>40%


>50%


>60%


>70%


>80%


>90%


 Election Data and Statistics:
Data Sources:
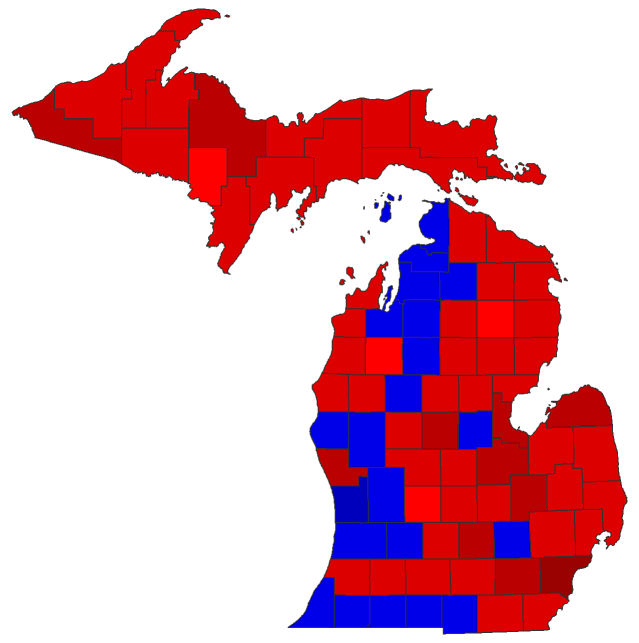
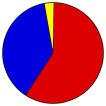
  • Source for Popular Vote data: Michigan Department of State. Bureau of Elections. 2012 Official Michigan General Election Results, Michigan Department of State. Bureau of Elections (http://miboecfr.nictusa.com/election/results/12GEN/05000000.html ) (accessed 27 Nov 2012)


Classic Michigan Results for 2012 - National Results for 2012

Login

Terms of Use - DCMA Policy - Privacy Policy and Cookies


© Dave Leip's Atlas of U.S. Elections, LLC 2019 All Rights Reserved