Home
2024
Election Results
Election Info
Weblog
Forum
Wiki
Search
Email
Login
Site Info
Store
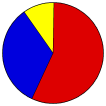
2016 Senatorial General Election - Oregon
Note: The Google advertisement links below may advocate political positions that this site does not endorse.
Choose Office
President
Governor
Official Results
Choose State
Alabama Class 3
Alaska Class 3
Arizona Class 3
Arkansas Class 3
California Class 3
Colorado Class 3
Connecticut Class 3
Florida Class 3
Georgia Class 3
Hawaii Class 3
Idaho Class 3
Illinois Class 3
Indiana Class 3
Iowa Class 3
Kansas Class 3
Kentucky Class 3
Louisiana Class 3
Maryland Class 3
Missouri Class 3
Nevada Class 3
New Hampshire Class 3
New York Class 3
North Carolina Class 3
North Dakota Class 3
Ohio Class 3
Oklahoma Class 3
Pennsylvania Class 3
South Carolina Class 3
South Dakota Class 3
Utah Class 3
Vermont Class 3
Washington Class 3
Wisconsin Class 3
Senatorial
Candidate
Political
Party
Popular Vote
Ronald L. Wyden
Democratic
1,105,119
56.60%
Mark Callahan
Republican
651,106
33.35%
Shanti S. Lewallen
Working Families
61,915
3.17%
Steven C. Reynolds
Independent
59,516
3.05%
Eric Navickas
Pacific Green
48,823
2.50%
Jim Lindsay
Libertarian
23,941
1.23%
Write-ins
-
2,058
0.11%
Total Vote
1,952,478
Maps
(Note: click the 'H' buttons above to hold the given map and change the image map)
Per
Democratic
Republican
Pie
>20%
>30%
>40%
>50%
>60%
>70%
>80%
>90%
Election Data and Statistics:
County Data (Table)
(m)
County Data (Graphs)
Precinct Data
(m)
Precinct Data Search
(m)
Purchase Detailed Data
Compare State Data by Year (Table)
Compare State Data by Year (Graphs)
View All 2016 Oregon Data
Compare State Maps by Year
View All 2016 Oregon Maps
Data Sources:
Source for Popular Vote data: Oregon Secretary of State Elections Division, "US Senator,"
November 8, 2016, General Election Abstract of Votes
(Salem, 2016)
< 2014
Choose Year
2022
2020
2014
2010
2020 >
Classic Oregon Results for 2016
-
National Results for 2016
Login
Terms of Use
-
DCMA Policy
-
Privacy Policy and Cookies
©
Dave Leip's Atlas of U.S. Elections, LLC 2019 All Rights Reserved