Note: The Google advertisement links below may advocate political positions that this site does not endorse.
Official Results
  Presidential
Candidate
Vice Presidential
Candidate
Political
Party
Popular VoteElectoral Vote
Barack H. ObamaJoseph R. Biden, Jr.Democratic 2,990,274 51.95%20
Willard Mitt RomneyPaul RyanRepublican 2,680,434 46.57%0
Gary JohnsonJames P. GrayLibertarian 49,991 0.87%0
Jill SteinCheri HonkalaGreen 21,341 0.37%0
YOther (+) - - 13,580 0.24%0
Total Vote 5,755,620
Maps
2012 Presidential General Election - Pennsylvania Election County Map
County H
County Pop H
2008 Button H
Per Vote Democratic Button H
Per Vote Republican Button H
Swing Map Button H
Trend Map Button H
Town H
Last Button H
Per Vote Democratic Button H
Per Vote Republican Button H
Swing Map Button H
Trend Map Button H
County H
 
(Note: click the 'H' buttons above to hold the given map and change the image map)
PerDemocraticRepublicanPie
>20%
 
0
 
 
0
 
pie
>30%
 
0
 
 
0
 
>40%
 
47
 
 
47
 
>50%
 
328
 
 
328
 
>60%
 
108
 
 
108
 
>70%
 
30
 
 
30
 
>80%
 
15
 
 
15
 
>90%
 
8
 
 
8
 
 Election Data and Statistics:
Data Sources:
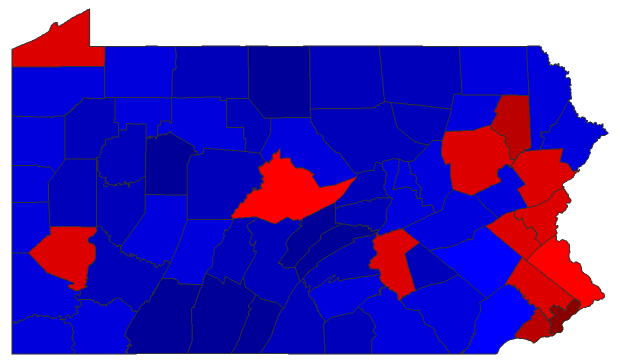
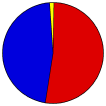
  • Source for Popular Vote data: Pennsylvania Department of State Bureau of Commissions, Elections and Legislation. 2012 General Election Tuesday, November 06, 2012 Official Returns President of the United States by County, Pennsylvania Department of State Bureau of Commissions, Elections and Legislation (http://www.electionreturns.state.pa.us/ElectionsInformation.aspx?FunctionID=15&ElectionID=53&OfficeID=1 ) (accessed 13 Dec 2012)
Election Notes:
  • Official Results do not count any write-in votes. The write-ins votes listed here were collected from each county election agency (incomplete tally).


Classic Pennsylvania Results for 2012 - National Results for 2012

Login

Terms of Use - DCMA Policy - Privacy Policy and Cookies


© Dave Leip's Atlas of U.S. Elections, LLC 2019 All Rights Reserved