Note: The Google advertisement links below may advocate political positions that this site does not endorse.
Official Results
  Senatorial
Candidate
Political
Party
Popular Vote
Robert P. Casey, Jr.Democratic 2,792,437 55.74%
Louis J. BarlettaRepublican 2,134,848 42.62%
Dale R. Kerns, Jr.Libertarian 50,907 1.02%
Neal Taylor GaleGreen 31,208 0.62%
Total Vote 5,009,400
Maps
2018 Senatorial General Election - Pennsylvania Election County Map
County H
County Pop H
2012 Button H
Per Vote Democratic Button H
Per Vote Republican Button H
Swing Map Button H
Trend Map Button H
 
(Note: click the 'H' buttons above to hold the given map and change the image map)
PerDemocraticRepublicanPie
>20%


pie
>30%


>40%


>50%


>60%


>70%


>80%


>90%


 Election Data and Statistics:
Data Sources:
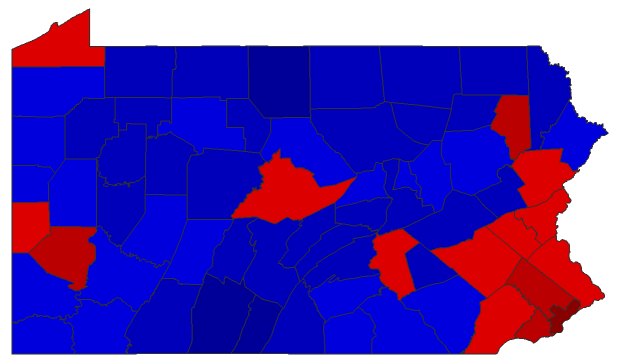
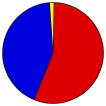
  • Source for Popular Vote data: Pennsylvania Department of State. Bureau of Commissions, Elections and Legislation. 2018 General Election Tuesday, November 6, 2018 Official Results, Pennsylvania Department of State. Bureau of Commissions, Elections and Legislation (https://electionreturns.pa.gov/General/CountyBreakDownResults?officeId=2&districtId=1&ElectionID=undefined&ElectionType=undefined&IsActive=undefined) (accessed 13 Dec 2018)


Classic Pennsylvania Results for 2018 - National Results for 2018

Login

Terms of Use - DCMA Policy - Privacy Policy and Cookies


© Dave Leip's Atlas of U.S. Elections, LLC 2019 All Rights Reserved