Note: The Google advertisement links below may advocate political positions that this site does not endorse.
Official Results
  Senatorial
Candidate
Political
Party
Popular Vote
Lamar AlexanderRepublican 850,087 61.87%
Gordon BallDemocratic 437,848 31.87%
Joe WilmothConstitution 36,088 2.63%
Martin PleasantGreen 12,570 0.91%
Tom Emerson, Jr.Independent 11,157 0.81%
Danny PageIndependent 7,713 0.56%
Rick TylerIndependent 5,759 0.42%
Joshua JamesIndependent 5,678 0.41%
YOther (+) - 7,160 0.52%
Total Vote 1,374,060
Maps
2014 Senatorial General Election - Tennessee Election County Map
County H
County Pop H
2008 Button H
Per Vote Republican Button H
Per Vote Democratic Button H
Swing Map Button H
Trend Map Button H
 
(Note: click the 'H' buttons above to hold the given map and change the image map)
PerDemocraticRepublicanPie
>20%


pie
>30%


>40%


>50%


>60%


>70%


>80%


>90%


 Election Data and Statistics:
Data Sources:
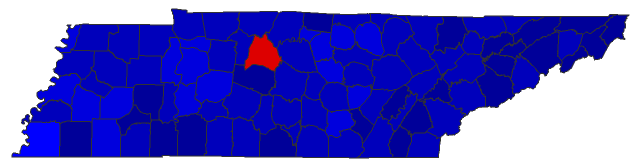
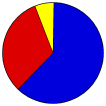
  • Source for Popular Vote data: Tennessee Secretary of State. Division of Elections. State of Tennessee November 4, 2014 State General, Tennessee Secretary of State. Division of Elections (http://state.tn.us/sos/election/results/20141104_StateCertCountyTotals.pdf ) (accessed 11 Dec 2014)


Classic Tennessee Results for 2014 - National Results for 2014

Login

Terms of Use - DCMA Policy - Privacy Policy and Cookies


© Dave Leip's Atlas of U.S. Elections, LLC 2019 All Rights Reserved