Note: The Google advertisement links below may advocate political positions that this site does not endorse.
Official Results
  Presidential
Candidate
Vice Presidential
Candidate
Political
Party
Popular VoteElectoral Vote
Donald J. TrumpMichael R. PenceRepublican 1,852,475 60.66%11
Joseph R. Biden, Jr.Kamala D. HarrisDemocratic 1,143,711 37.45%0
Dr. Jo JorgensenJeremy 'Spike' CohenIndependent 29,877 0.98%0
Kanye WestMichelle TidballIndependent 10,279 0.34%0
YOther (+) - - 17,509 0.57%0
Total Vote 3,053,851
Maps
2020 Presidential General Election - Tennessee Election County Map
County H
County Pop H
2016 Button H
Per Vote Republican Button H
Per Vote Democratic Button H
Swing Map Button H
Trend Map Button H
 
(Note: click the 'H' buttons above to hold the given map and change the image map)
PerDemocraticRepublicanPie
>20%


pie
>30%


>40%


>50%


>60%


>70%


>80%


>90%


 Election Data and Statistics:
Data Sources:
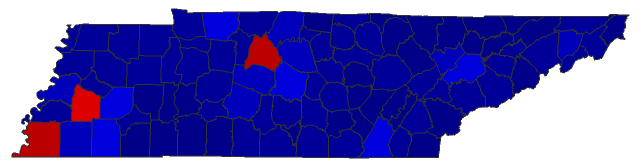
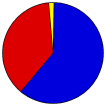
  • Source for Popular Vote data: Tennessee Secretary of State Division of Elections. 2020 Election Results November 3, 2020 Results by County United States President, Tennessee Secretary of State Division of Elections (https://sos-tn-gov-files.tnsosfiles.com/Nov%202020%20General%20by%20County.pdf) (accessed 2020-12-02)


Classic Tennessee Results for 2020 - National Results for 2020

Login

Terms of Use - DCMA Policy - Privacy Policy and Cookies


© Dave Leip's Atlas of U.S. Elections, LLC 2019 All Rights Reserved