Note: The Google advertisement links below may advocate political positions that this site does not endorse.
Official Results
  Presidential
Candidate
Vice Presidential
Candidate
Political
Party
Popular VoteElectoral Vote
Hillary ClintonTimothy KaineDemocratic 235,603 53.09%3
Donald J. TrumpMichael R. PenceRepublican 185,127 41.71%0
Gary JohnsonWilliam F. WeldLibertarian DE 14,757 3.33%0
Dr. Jill SteinAjamu BarakaGreen DE 6,103 1.38%0
Write-ins-- 1,423 0.32%0
YOther (+) - - 801 0.18%0
Total Vote 443,814
Maps
2016 Presidential General Election - Delaware Election County Map
County H
County Pop H
2012 Button H
Per Vote Democratic Button H
Per Vote Republican Button H
Swing Map Button H
Trend Map Button H
County H
 
(Note: click the 'H' buttons above to hold the given map and change the image map)
PerDemocraticRepublicanPie
>20%


pie
>30%


>40%


>50%


>60%


>70%


>80%


>90%


 Election Data and Statistics:
Data Sources:
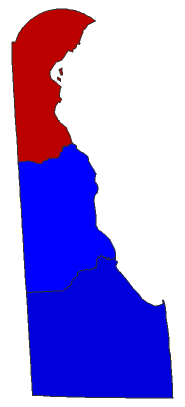
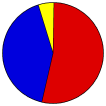
  • Source for Popular Vote data: State of Delaware Department of Elections. State Of Delaware Elections System Official Election Results General Elections - 11/08/16 Statewide Offices By County, State of Delaware Department of Elections (http://elections.delaware.gov/results/html/stwoff_kns.shtml) (accessed 18 Nov 2016)


Classic Delaware Results for 2016 - National Results for 2016

Login

Terms of Use - DCMA Policy - Privacy Policy and Cookies


© Dave Leip's Atlas of U.S. Elections, LLC 2019 All Rights Reserved