Note: The Google advertisement links below may advocate political positions that this site does not endorse.
Official Results
  Gubernatorial
Candidate
Political
Party
Popular Vote
Roy CooperDemocratic 2,309,157 49.02%
Pat McCroryRepublican 2,298,880 48.80%
Lon CecilLibertarian 102,977 2.19%
Total Vote 4,711,014
Maps
2016 Gubernatorial General Election - North Carolina Election County Map
County H
County Pop H
2012 Button H
Per Vote Democratic Button H
Per Vote Republican Button H
Swing Map Button H
Trend Map Button H
 
(Note: click the 'H' buttons above to hold the given map and change the image map)
PerDemocraticRepublicanPie
>20%


pie
>30%


>40%


>50%


>60%


>70%


>80%


>90%


 Election Data and Statistics:
Data Sources:
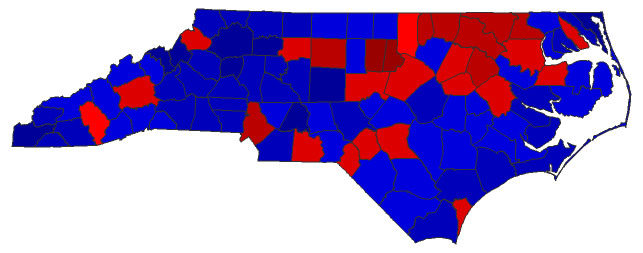
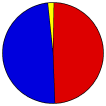
  • Source for Popular Vote data: North Carolina State Board of Elections. 11/08/2016 Official General Election Results - Statewide, North Carolina State Board of Elections (http://er.ncsbe.gov/contest_details.html?election_dt=11/08/2016&county_id=0&contest_id=1016) (accessed 16 Dec 2016)


Classic North Carolina Results for 2016 - National Results for 2016

Login

Terms of Use - DCMA Policy - Privacy Policy and Cookies


© Dave Leip's Atlas of U.S. Elections, LLC 2019 All Rights Reserved