Note: The Google advertisement links below may advocate political positions that this site does not endorse.
Official Results
  Presidential
Candidate
Vice Presidential
Candidate
Political
Party
Popular VoteElectoral Vote
Donald J. TrumpMichael R. PenceRepublican 949,136 65.32%7
Hillary ClintonTimothy KaineDemocratic 420,375 28.93%0
Gary JohnsonWilliam F. WeldLibertarian 83,481 5.75%0
Total Vote 1,452,992
Maps
2016 Presidential General Election - Oklahoma Election County Map
County H
County Pop H
2012 Button H
Per Vote Republican Button H
Per Vote Democratic Button H
Per Vote Libertarian Button H
Swing Map Button H
Trend Map Button H
 
(Note: click the 'H' buttons above to hold the given map and change the image map)
PerDemocraticRepublicanPie
>20%


pie
>30%


>40%


>50%


>60%


>70%


>80%


>90%


 Election Data and Statistics:
Data Sources:
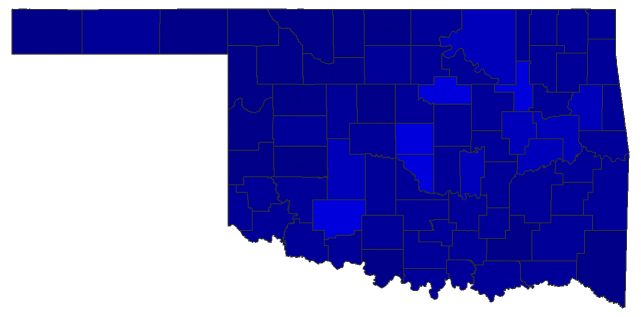
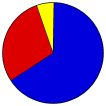
  • Source for Popular Vote data: Oklahoma State Election Board. Official Results General Election - November 8, 2016 - Race-level results by county for all races, Oklahoma State Election Board (https://www.ok.gov/elections/Election_Info/2016_November_General_Election.html) (accessed 18 Nov 2016)


Classic Oklahoma Results for 2016 - National Results for 2016

Login

Terms of Use - DCMA Policy - Privacy Policy and Cookies


© Dave Leip's Atlas of U.S. Elections, LLC 2019 All Rights Reserved