Note: The Google advertisement links below may advocate political positions that this site does not endorse.
Official Results
  Presidential
Candidate
Home StatePolitical
Party
Primary VoteDelegates
Joe BidenDelawareDemocratic 986,661 58.76%96 52.2%
Bernie SandersVermontDemocratic 605,701 36.07%59 32.1%
Mike BloombergNew YorkDemocratic 25,500 1.52%0 0.0%
Elizabeth WarrenMassachusettsDemocratic 24,413 1.45%0 0.0%
Pete ButtigiegIndianaDemocratic 9,729 0.58%0 0.0%
Tulsi GabbardHawaiiDemocratic 9,642 0.57%0 0.0%
Andrew YangNew YorkDemocratic 4,021 0.24%0 0.0%
Write-ins-Democratic 2,948 0.18%0 0.0%
Cory BookerNew JerseyDemocratic 2,684 0.16%0 0.0%
Amy KlobucharMinnesotaDemocratic 2,017 0.12%0 0.0%
Tom SteyerCaliforniaDemocratic 1,684 0.10%0 0.0%
Deval PatrickMassachusettsDemocratic 1,567 0.09%0 0.0%
Michael BennetColoradoDemocratic 1,346 0.08%0 0.0%
John DelaneyMarylandDemocratic 1,185 0.07%0 0.0%
YUnallocated - Democratic - -2915.8%
Total Vote 1,679,098
Maps
2020 Presidential Democratic Primary - Illinois Election County Map
County H
County Pop H
Per Vote Democratic Button H
Town H
Town Pop H
Per Vote Democratic Button H
County H
 
(Note: click the 'H' buttons above to hold the given map and change the image map)
PerBidenSandersPie
>20%
 
0
 
 
0
 
pie
>30%
 
0
 
 
0
 
>40%
 
0
 
 
0
 
>50%
 
0
 
 
0
 
>60%
 
0
 
 
0
 
>70%
 
0
 
 
0
 
>80%
 
0
 
 
0
 
>90%
 
0
 
 
0
 
 Election Data and Statistics:
Data Sources:
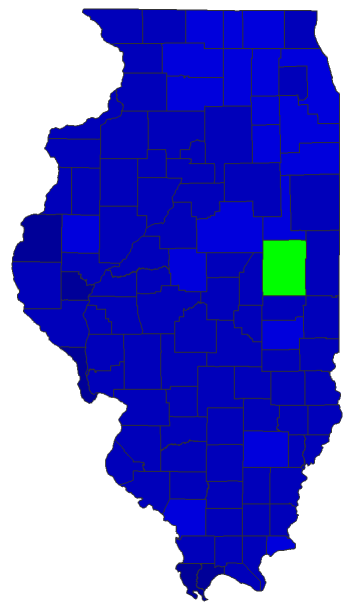
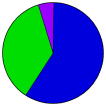
  • Source for Popular Vote data: Illinois State Board of Elections. Official Canvass General Primary Election March 17, 2020, Illinois State Board of Elections (https://www.elections.il.gov/DocDisplay.aspx?doc=Downloads/ElectionOperations/VoteTotals/2020/ByCounty/2020GPOfficialVote.pdf) (accessed 22 Oct 2020)


Classic Illinois Results for 2020 - National Results for 2020

Login

Terms of Use - DCMA Policy - Privacy Policy and Cookies


© Dave Leip's Atlas of U.S. Elections, LLC 2019 All Rights Reserved