Home
2024
Election Results
Election Info
Weblog
Forum
Wiki
Search
Email
Login
Site Info
Store
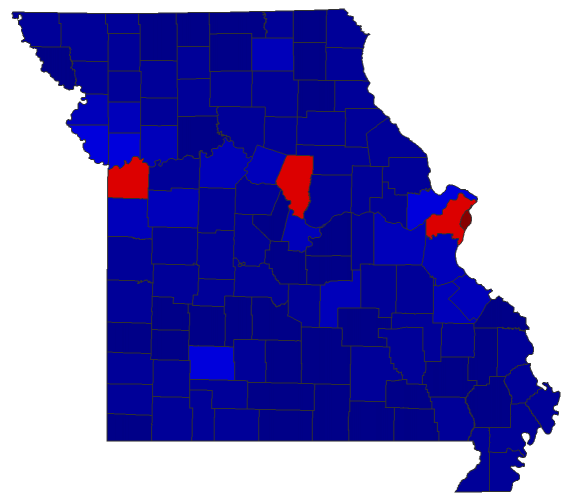
2020 Gubernatorial General Election - Missouri
Note: The Google advertisement links below may advocate political positions that this site does not endorse.
Choose Office
President
Official Results
Choose State
Delaware
Indiana
Missouri
Montana
New Hampshire
North Carolina
North Dakota
Utah
Vermont
Washington
West Virginia
Gubernatorial
Candidate
Political
Party
Popular Vote
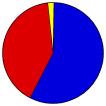
Mike Parson
Republican
1,720,202
57.11%
Nicole Galloway
Democratic
1,225,771
40.69%
Rik Combs
Libertarian
49,067
1.63%
Jerome Howard Bauer
Green
17,234
0.57%
Other (
+
)
-
13
0.00%
Total Vote
3,012,287
Maps
(Note: click the 'H' buttons above to hold the given map and change the image map)
Per
Democratic
Republican
Pie
>20%
>30%
>40%
>50%
>60%
>70%
>80%
>90%
Election Data and Statistics:
County Data (Table)
(m)
County Data (Graphs)
Purchase Detailed Data
Compare State Data by Year (Table)
Compare State Data by Year (Graphs)
View All 2020 Missouri Data
Compare State Maps by Year
View All 2020 Missouri Maps
Data Sources:
Source for Popular Vote data: Missouri Office of the Secretary of State Elections.
X
, Missouri Office of the Secretary of State Elections (https://enr.sos.mo.gov/PickaRace.aspx) (accessed 08 Dec 2020)
< 2016
Choose Year
2016
2012
Classic Missouri Results for 2020
-
National Results for 2020
Login
Terms of Use
-
DCMA Policy
-
Privacy Policy and Cookies
©
Dave Leip's Atlas of U.S. Elections, LLC 2019 All Rights Reserved