Note: The Google advertisement links below may advocate political positions that this site does not endorse.
Official Results
  Gubernatorial
Candidate
Political
Party
Popular Vote
Bill LeeRepublican 1,129,390 64.91%
Jason Brantley MartinDemocratic 572,818 32.92%
John GentryIndependent 15,395 0.88%
Constance M. EveryIndependent 10,277 0.59%
YOther (+) - 12,002 0.69%
Total Vote 1,739,882
Maps
2022 Gubernatorial General Election - Tennessee Election County Map
County H
2018 Button H
Per Vote Republican Button H
Per Vote Democratic Button H
Swing Map Button H
Trend Map Button H
 
(Note: click the 'H' buttons above to hold the given map and change the image map)
PerDemocraticRepublicanPie
>20%


pie
>30%


>40%


>50%


>60%


>70%


>80%


>90%


 Election Data and Statistics:
Data Sources:
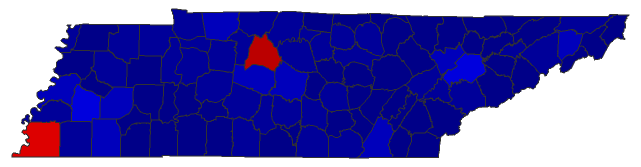
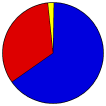
  • Source for Popular Vote data: Tennessee Secretary of State. Division of Elections. November 8, 2022 State General Governor, Tennessee Secretary of State. Division of Elections (https://sos-prod.tnsosgovfiles.com/s3fs-public/document/20221108GovbyCounty.pdf) (accessed 2023-01-12)


Classic Tennessee Results for 2022 - National Results for 2022

Login

Terms of Use - DCMA Policy - Privacy Policy and Cookies


© Dave Leip's Atlas of U.S. Elections, LLC 2019 All Rights Reserved