| | Presidential
Candidate | Vice Presidential
Candidate | Political
Party | Popular Vote |
|---|
 |
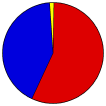
Barack H. Obama | Joseph R. Biden, Jr. | Democratic | | |
372,566 |
56.42% |
 |
John S. McCain, III | Sarah Palin | Republican | | |
276,956 |
41.94% |
 |
Ralph Nader | Matt Gonzalez | Natural Law | | |
3,627 |
0.55% |
|
Bob Barr | Wayne A. Root | Libertarian | | |
3,407 |
0.52% |
|
Charles O. Baldwin | Darrell L. Castle | U.S. Taxpayers | | |
1,531 |
0.23% |
|
Write-ins | - | - | | |
1,327 |
0.20% |
|
Cynthia A. McKinney | Rosa A. Clemente | Green | | |
978 |
0.15% |
|
Alan Keyes | - | - | | |
2 |
0.00% |
|
Brian Moore | - | - | | |
1 |
0.00% |
 |
Map Key
| > 40% |
 |
 |
| > 50% |
 |
 |
| > 60% |
 |
 |
| > 70% |
 |
 |
| > 80% |
 |
|
| > 90% |
 |
 |
| Turnout
 |
 |
|
| Maps | County Township Map (m) |  |  |
 |
 |
 |
 |
| |
| Demographic Data
| 2010 Population: | 1,202,362 | Enum. | 2010 Population Density: | 532.0 | persons/km2 | | 2008 Population: | 1,199,545 | Est. | 2008 Population Density: | 530.8 | persons/km2 | | 2000 Population: | 1,194,156 | Enum. | 2000 Population Density: | 528.4 | persons/km2 | | Land Area (2000): | 2,260 | km2 | Annual Pop Growth Rate: | 0.1 | % |
| Data and Statistics:
- City and Town Data (Table) (m)
- City and Town Data (Graphs) (m)
|
- Compare County Data by Year (Table) (m)
- Compare County Data by Year (Graphs) (m)
- Compare County Maps by Year (m)
| | Election Notes:
- Results include an incomplete write-in vote tally collected from county election agencies that are not reported in statwide results.
|
| | |


