| | Presidential
Candidate | Vice Presidential
Candidate | Political
Party | Popular Vote |
|---|
 |
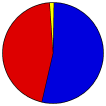
John S. McCain, III | Sarah Palin | Republican | | |
16,030 |
53.17% |
 |
Barack H. Obama | Joseph R. Biden, Jr. | Democratic | | |
13,655 |
45.29% |
 |
Ralph Nader | Matt Gonzalez | Populist | | |
200 |
0.66% |
|
Bob Barr | Wayne A. Root | Libertarian | | |
118 |
0.39% |
|
Cynthia A. McKinney | Rosa A. Clemente | Green | | |
77 |
0.26% |
| Other (+) | - | - | | | 69 |
0.23% |
 |
Map Key
| Turnout
 |
 |
|
| Maps | County Township Map (m) |  |  |
 |
 |
 |
 |
| |
| Demographic Data
| 2010 Population: | 65,393 | Enum. | 2010 Population Density: | 39.9 | persons/km2 | | 2008 Population: | 65,637 | Est. | 2008 Population Density: | 40.1 | persons/km2 | | 2000 Population: | 64,328 | Enum. | 2000 Population Density: | 39.3 | persons/km2 | | Land Area (2000): | 1,637 | km2 | Annual Pop Growth Rate: | 0.2 | % |
| Data and Statistics:
- City and Town Data (Table) (m)
- City and Town Data (Graphs) (m)
- Precinct Data (Table) (m)
|
- Compare County Data by Year (Table) (m)
- Compare County Data by Year (Graphs) (m)
- Compare County Maps by Year (m)
| | Election Notes:
- Obama vote is the fusion of Democratic and Working Families parties.
- McCain vote is the fusion of Republican, Independence, and Conservative parties.
|
| | |


