| | Presidential
Candidate | Vice Presidential
Candidate | Political
Party | Popular Vote |
|---|
 |
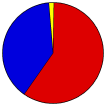
Barack H. Obama | Joseph R. Biden, Jr. | Democratic | | | | | |
129,317 |
59.25% |
 |
John S. McCain, III | Sarah Palin | Republican | | | | | |
84,972 |
38.94% |
 |
Ralph Nader | Matt Gonzalez | Populist | | | | | |
1,969 |
0.90% |
|
Bob Barr | Wayne A. Root | Libertarian | | | | | |
1,328 |
0.61% |
|
Cynthia A. McKinney | Rosa A. Clemente | Green | | | | | |
399 |
0.18% |
|
Róger Calero | Alyson Kennedy | Socialist Workers | | | | | |
135 |
0.06% |
|
Gloria La Riva | Eugene Puryear | Socialism and Liberation | | | | | |
74 |
0.03% |
|
Write-ins | - | - | | | | | |
45 |
0.02% |
 |
Map Key
| Turnout
 |
 |
|
| Maps | County Township Map (m) |  |  |
 |
 |
 |
 |
| |
| Demographic Data
| 2010 Population: | 467,026 | Enum. | 2010 Population Density: | 231.1 | persons/km2 | | 2008 Population: | 463,472 | Est. | 2008 Population Density: | 229.3 | persons/km2 | | 2000 Population: | 458,336 | Enum. | 2000 Population Density: | 226.8 | persons/km2 | | Land Area (2000): | 2,021 | km2 | Annual Pop Growth Rate: | 0.2 | % |
| Data and Statistics:
- City and Town Data (Table) (m)
- City and Town Data (Graphs) (m)
- Precinct Data (Table) (m)
|
- Compare County Data by Year (Table) (m)
- Compare County Data by Year (Graphs) (m)
- Compare County Maps by Year (m)
| | Election Notes:
- Obama vote is the fusion of Democratic and Working Families parties.
- McCain vote is the fusion of Republican, Independence, and Conservative parties.
|
| | |


