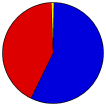
2010 Senatorial General Election Results - Marinette County, WI
Note: The Google advertisement links below may advocate political positions that this site does not endorse.
 Senatorial
Candidate
Political PartyPopular Vote
Ron JohnsonRepublican 8,317 56.67%
Russ FeingoldDemocratic 6,214 42.34%
Rob TaylorIndependent 142 0.97%
Scattering- 2 0.01%
Seal Map Key
 > 40%
 > 50%
 > 60%
 > 70%
 > 80%
Turnout
Voter Turnout Graph
Pie Chart
MapsCounty Township Map (m)
Town
Last Button
Per Vote Republican Button
Per Vote Democratic Button
Swing Map Button
Trend Map Button
 
Demographic Data

2010 Population:41,749Enum.2010 Population Density:11.5persons/km2
2000 Population:43,384Enum.2000 Population Density:11.9persons/km2
Land Area (2000):3,631km2Annual Pop Growth Rate:-0.4%

Data and Statistics:
  • City and Town Data (Table) (m)
  • City and Town Data (Graphs) (m)
  • Precinct Data (Table) (m)
  • Compare County Data by Year (Table) (m)
  • Compare County Data by Year (Graphs) (m)
  • Compare County Maps by Year (m)


National Results for 2010 - Wisconsin Results for 2010 - Use Frame Navigation

Login

Terms of Use - DCMA Policy - Privacy Policy and Cookies


© Dave Leip's Atlas of U.S. Elections, LLC 2019 All Rights Reserved
Stephenson Town 55075 Wagner Town 55075 Wausaukee Village 55075 Wausaukee Town 55075 Pound Town 55075 Silver Cliff Town 55075 Pound Village 55075 Porterfield Town 55075 Peshtigo Town 55075 Peshtigo City 55075 Pembine Town 55075 Niagara City 55075 Niagara Town 55075 Marinette City 55075 Middle Inlet Town 55075 Grover Town 55075 Coleman Village 55075 Crivitz Village 55075 Lake Town 55075 Dunbar Town 55075 Goodman Town 55075 Beecher Town 55075 Beaver Town 55075 Amberg Town 55075 Athelstane Town 55075 Marinette City 55075 Peshtigo Town 55075