| | Presidential
Candidate | Vice Presidential
Candidate | Political
Party | Popular Vote |
|---|
 |
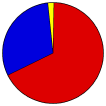
Barack H. Obama | Joseph R. Biden, Jr. | Democratic | | | |
34,302 |
67.40% |
 |
Willard Mitt Romney | Paul Ryan | Republican | | | |
15,496 |
30.45% |
 |
Gary Johnson | James P. Gray | Libertarian | | | |
692 |
1.36% |
|
Chuck Baldwin | Joseph Martin | Reform | | | |
205 |
0.40% |
|
Write-ins | - | - | | | |
155 |
0.30% |
|
Jill Stein | Cheri Honkala | Write-in | | | |
24 |
0.05% |
|
Virgil H. Goode, Jr. | James N. Clymer | Write-in | | | |
13 |
0.03% |
|
Ross C. 'Rocky' Anderson | Luis J. Rodriguez | Write-in | | | |
2 |
0.00% |
|
Roseanne Barr | Cindy Sheehan | Write-in | | | |
2 |
0.00% |
|
Thomas Hoefling | Jonathan D. Ellis | Write-in | | | |
1 |
0.00% |
|
Andre Barnett | Kenneth Cross | Write-in | | | |
1 |
0.00% |
 |
Map Key
| Turnout
 |
 |
|
| Maps | County Township Map (m) |  |  |
 |
 |
 |
 |
| |
| Demographic Data
| 2012 Population: | 159,424 | Est. | 2012 Population Density: | 406.7 | persons/km2 | | 2010 Population: | 157,505 | Enum. | 2010 Population Density: | 401.8 | persons/km2 | | Land Area (2000): | 392 | km2 | Annual Pop Growth Rate: | 0.6 | % |
| Data and Statistics:
- City and Town Data (Table) (m)
- City and Town Data (Graphs) (m)
|
- Compare County Data by Year (Table) (m)
- Compare County Data by Year (Graphs) (m)
- Compare County Maps by Year (m)
| |
| | |


