| | Presidential
Candidate | Vice Presidential
Candidate | Political
Party | Popular Vote |
|---|
 |
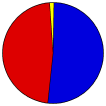
Willard Mitt Romney | Paul Ryan | Republican | | | | | |
5,075 |
51.26% |
 |
Barack H. Obama | Joseph R. Biden, Jr. | Democratic | | | | | |
4,685 |
47.32% |
 |
Jill Stein | Cheri Honkala | Green | | | | | |
46 |
0.46% |
|
Virgil H. Goode, Jr. | James N. Clymer | U.S. Taxpayers | | | | | |
39 |
0.39% |
|
Stewart Alexander | | | | | | | |
39 |
0.39% |
| Other (+) | - | - | | | | | | 17 |
0.17% |
 |
Map Key
| Turnout
 |
 |
|
| Maps | County Township Map (m) |  |  |
 |
 |
 |
 |
| |
| Demographic Data
| 2012 Population: | 17,319 | Est. | 2012 Population Density: | 20.8 | persons/km2 | | 2010 Population: | 17,525 | Enum. | 2010 Population Density: | 21.1 | persons/km2 | | Land Area (2000): | 832 | km2 | Annual Pop Growth Rate: | -0.6 | % |
| Data and Statistics:
- City and Town Data (Table) (m)
- City and Town Data (Graphs) (m)
|
- Compare County Data by Year (Table) (m)
- Compare County Data by Year (Graphs) (m)
- Compare County Maps by Year (m)
| | Primary Documentation:| Document |
Description |
Status |
Date |
Size |
 |
Summary Report (m) | |
Unlabeled |
2012-11-06 |
20kB |
| Election Notes:
- Official Results do not count any write-in votes. The write-ins votes listed here were collected from each county election agency (incomplete tally).
|
| | |


