| | Presidential
Candidate | Vice Presidential
Candidate | Political
Party | Popular Vote |
|---|
 |
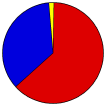
Barack H. Obama | Joseph R. Biden, Jr. | Democratic | | | | | |
80,847 |
63.01% |
 |
Willard Mitt Romney | Paul Ryan | Republican | | | | | |
45,306 |
35.31% |
 |
Jill Stein | Cheri Honkala | Green | | | | | |
755 |
0.59% |
|
Gary Johnson | | | | | | | |
439 |
0.34% |
|
Write-ins | - | - | | | | | |
400 |
0.31% |
|
Virgil H. Goode, Jr. | James N. Clymer | U.S. Taxpayers | | | | | |
395 |
0.31% |
|
Ross C. 'Rocky' Anderson | Luis J. Rodriguez | Natural Law | | | | | |
160 |
0.12% |
|
Thomas Hoefling | | | | | | | |
6 |
0.00% |
|
Stewart Alexander | | | | | | | |
1 |
0.00% |
|
Jerry White | | | | | | | |
1 |
0.00% |
 |
Map Key
| Turnout
 |
 |
|
| Maps | County Township Map (m) |  |  |
 |
 |
 |
 |
| |
| Demographic Data
| 2012 Population: | 283,592 | Est. | 2012 Population Density: | 195.9 | persons/km2 | | 2010 Population: | 280,895 | Enum. | 2010 Population Density: | 194.0 | persons/km2 | | Land Area (2000): | 1,448 | km2 | Annual Pop Growth Rate: | 0.5 | % |
| Data and Statistics:
- City and Town Data (Table) (m)
- City and Town Data (Graphs) (m)
|
- Compare County Data by Year (Table) (m)
- Compare County Data by Year (Graphs) (m)
- Compare County Maps by Year (m)
| | Primary Documentation:| Document |
Description |
Status |
Date |
Size |
 |
Summary Report (m) | |
Unlabeled |
2012-11-14 |
160kB |
| Election Notes:
- Official Results do not count any write-in votes. The write-ins votes listed here were collected from each county election agency (incomplete tally).
|
| | |


