| | Presidential
Candidate | Vice Presidential
Candidate | Political
Party | Popular Vote |
|---|
 |
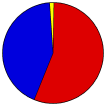
Barack H. Obama | Joseph R. Biden, Jr. | Democratic | | | | |
69,051 |
55.83% |
 |
Willard Mitt Romney | Paul Ryan | Republican | | | | |
52,662 |
42.58% |
 |
Jill Stein | Cheri Honkala | Green | | | | |
692 |
0.56% |
|
Write-ins | - | - | | | | |
512 |
0.41% |
|
Virgil H. Goode, Jr. | James N. Clymer | U.S. Taxpayers | | | | |
344 |
0.28% |
|
Gary Johnson | | | | | | |
283 |
0.23% |
|
Ross C. 'Rocky' Anderson | Luis J. Rodriguez | Natural Law | | | | |
139 |
0.11% |
|
Stewart Alexander | | | | | | |
3 |
0.00% |
|
Thomas Hoefling | | | | | | |
3 |
0.00% |
|
Jerry White | | | | | | |
1 |
0.00% |
 |
Map Key
| Turnout
 |
 |
|
| Maps | County Township Map (m) |  |  |
 |
 |
 |
 |
| |
| Demographic Data
| 2012 Population: | 255,413 | Est. | 2012 Population Density: | 175.5 | persons/km2 | | 2010 Population: | 250,331 | Enum. | 2010 Population Density: | 172.0 | persons/km2 | | Land Area (2000): | 1,455 | km2 | Annual Pop Growth Rate: | 1.0 | % |
| Data and Statistics:
- City and Town Data (Table) (m)
- City and Town Data (Graphs) (m)
|
- Compare County Data by Year (Table) (m)
- Compare County Data by Year (Graphs) (m)
- Compare County Maps by Year (m)
| | Election Notes:
- Official Results do not count any write-in votes. The write-ins votes listed here were collected from each county election agency (incomplete tally).
|
| | |


