| | Presidential
Candidate | Vice Presidential
Candidate | Political
Party | Popular Vote |
|---|
 |
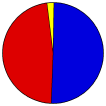
Willard Mitt Romney | Paul Ryan | Republican | | |
93,430 |
50.11% |
 |
Barack H. Obama | Joseph R. Biden, Jr. | Democratic-F.L. | | |
88,614 |
47.52% |
 |
Gary Johnson | James P. Gray | Libertarian | | |
2,284 |
1.22% |
|
Write-ins | - | - | | |
747 |
0.40% |
|
Jill Stein | Cheri Honkala | Green | | |
687 |
0.37% |
|
Virgil H. Goode, Jr. | James N. Clymer | Constitution | | |
233 |
0.12% |
|
Jim Carlson | George McMahon | Grassroots | | |
207 |
0.11% |
|
Ross C. 'Rocky' Anderson | Luis J. Rodriguez | Justice | | |
122 |
0.07% |
|
Dean Morstad | Josh Franke-Hyland | Const. Government | | |
76 |
0.04% |
|
James Harris | Maura Deluca | Socialist Workers | | |
48 |
0.03% |
|
Peta Lindsay | Yari Osorio | Socialism and Liberation | | |
17 |
0.01% |
 |
Map Key
| Turnout
 |
 |
|
| Maps | County Township Map (m) |  |  |
 |
 |
 |
 |
| |
| Demographic Data
| 2012 Population: | 336,119 | Est. | 2012 Population Density: | 306.4 | persons/km2 | | 2010 Population: | 330,844 | Enum. | 2010 Population Density: | 301.6 | persons/km2 | | Land Area (2000): | 1,097 | km2 | Annual Pop Growth Rate: | 0.8 | % |
| Data and Statistics:
- City and Town Data (Table) (m)
- City and Town Data (Graphs) (m)
- Precinct Data (Table) (m)
|
- Compare County Data by Year (Table) (m)
- Compare County Data by Year (Graphs) (m)
- Compare County Maps by Year (m)
| |
| | |


