| | Presidential
Candidate | Vice Presidential
Candidate | Political
Party | Popular Vote |
|---|
 |
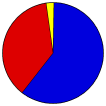
Willard Mitt Romney | Paul Ryan | Republican | | | | |
4,693 |
60.05% |
 |
Barack H. Obama | Joseph R. Biden, Jr. | Democratic-F.L. | | | | |
2,916 |
37.31% |
 |
Gary Johnson | James P. Gray | Libertarian | | | | |
113 |
1.45% |
|
Jill Stein | Cheri Honkala | Green | | | | |
36 |
0.46% |
|
Write-ins | - | - | | | | |
30 |
0.38% |
|
Jim Carlson | George McMahon | Grassroots | | | | |
11 |
0.14% |
|
Virgil H. Goode, Jr. | James N. Clymer | Constitution | | | | |
9 |
0.12% |
|
Ross C. 'Rocky' Anderson | Luis J. Rodriguez | Justice | | | | |
4 |
0.05% |
|
Dean Morstad | Josh Franke-Hyland | Const. Government | | | | |
2 |
0.03% |
|
Peta Lindsay | Yari Osorio | Socialism and Liberation | | | | |
1 |
0.01% |
 |
Map Key
| Turnout
 |
 |
|
| Maps | County Township Map (m) |  |  |
 |
 |
 |
 |
| |
| Demographic Data
| 2012 Population: | 15,082 | Est. | 2012 Population Density: | 9.9 | persons/km2 | | 2010 Population: | 15,226 | Enum. | 2010 Population Density: | 10.0 | persons/km2 | | Land Area (2000): | 1,525 | km2 | Annual Pop Growth Rate: | -0.5 | % |
| Data and Statistics:
- City and Town Data (Table) (m)
- City and Town Data (Graphs) (m)
- Precinct Data (Table) (m)
|
- Compare County Data by Year (Table) (m)
- Compare County Data by Year (Graphs) (m)
- Compare County Maps by Year (m)
| |
| | |


