2018 Gubernatorial General Election Results - Chittenden County, VT
Note: The Google advertisement links below may advocate political positions that this site does not endorse.
 Gubernatorial
Candidate
Political PartyPopular Vote
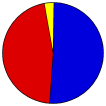
Phil ScottRepublican 38,443 50.63%
Christine HallquistDemocratic 35,121 46.25%
Trevor BarlowIndependent 621 0.82%
Stephen MarxEarth Rights 457 0.60%
Emily 'Em' PeytonLiberty Union 383 0.50%
Cris EricsonIndependent 356 0.47%
Charles LaramieIndependent 332 0.44%
Write-ins- 222 0.29%
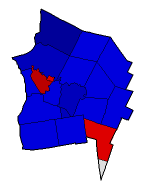
Seal Map Key
 > 40%
 > 50%
 > 60%
 > 70%
Turnout
Voter Turnout Graph
Pie Chart
Maps
2018 County Township Map
Town
Last Button
Per Vote Republican Button
Per Vote Democratic Button
Swing Map Button
Trend Map Button
 
Demographic Data

2010 Population:0Enum.2010 Population Density:0.0persons/km2
Land Area (2000):1,396km2

Data and Statistics:
  • City and Town Data (Table) (m)
  • City and Town Data (Graphs) (m)
  • Precinct Data (Table) (m)
  • Compare County Data by Year (Table) (m)
  • Compare County Data by Year (Graphs) (m)
  • Compare County Maps by Year (m)


National Results for 2018 - Vermont Results for 2018 - Use Frame Navigation

Login

Terms of Use - DCMA Policy - Privacy Policy and Cookies


© Dave Leip's Atlas of U.S. Elections, LLC 2019 All Rights Reserved
Charlotte Town 50007 Huntington Town 50007 Hinesburg Town 50007 St. George Town 50007 Richmond Town 50007 Shelburne Town 50007 Bolton Town 50007 Williston Town 50007 Winooski City 50007 South Burlington City 50007 Burlington City 50007 Jericho Town 50007 Essex Town 50007 Colchester Town 50007 Underhill Town 50007 Westford Town 50007 Milton Town 50007