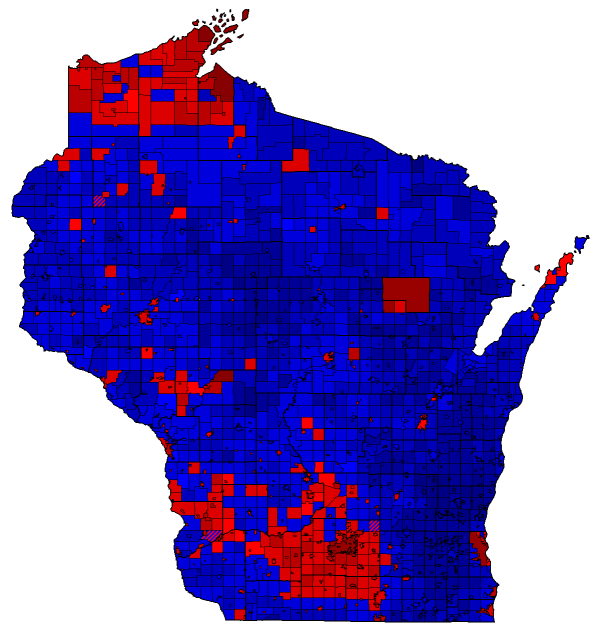
Wisconsin 2014 Gubernatorial Election Result Map by Municipality
The 2014 General Election result map for Governor in the state of Wisconsin tabulated by Municipality is complete (shown at right). The contest was between incumbent Republican Governor Scott Walker and Democratic candidate Mary Burke (results page). The final statewide percentages are almost an exact repeat of the 2010 contest between Scott Walker and Tom Barrett (results page). The 2014 result was Walker over Burke 52.26% to 46.59% and the 2010 result was Walker over Barrett 52.25% to 46.48%!
At the county and municipality level, the results are quite similar as well. Walker wins 1,508 municipalities with an average margin of 272 votes (median margin of 93 votes) to Burke’s 381 with an average margin of 715 votes and a median margin of 41 votes (the Democratic data are dominated by two municipalities – Milwaukee City with a margin of 109,679 and Madison City with a margin of 70,846). The largest Republican margin is in Brookfield City (Waukesha County) with 9,929 votes. Seven municipalities are ties. In 2010, Walker won 1,480 municipalities to Barrett’s 399 with 15 ties. The largest swings were in the north-central part of the state with Iron and Taylor Counties leading the Republican Swing percentage while the south and north-west portions of the state had Democratic Swings. Detailed maps are available here.