A very cool set of U.S. Presidents Bicycle Playing Cards is being developed through a KickStarter campaign. From the developer:
“The US Presidents deck has been in production for many months. Each card has been hand drawn to feature the most intricate details. This deck features all 44 presidents and 4 popular first ladies as queens. Although we can debate which presidents should have been on the court cards, we have done much research before making our choices. We chose based on popularity and the s influence on our s history. The remaining presidents are uniquely featured on the number cards.
The US President Deck was not only designed to appeal to the card collector audience, but also as a fully playable deck of cards. It will be hard not to reflect on our great s history and the accomplishments of our past leaders while playing with these cards.
We are launching this deck in February in honor of s Day (February 16th) here in the United States. Pick up a few packs to show your patriotism, and few extra to play with and admire. Our goal is to have these in your hands by Independence Day.”
The data sets for US House of Representative, US Senate, and Governor have been updated to version 1.0 and are available on the store page. Updates are, of course, free for those whom have already purchased these files. The update may be downloaded from your myatlas page. This update includes:
Amended official results plus write-in votes in West Virginia
New data from Texas to correct the absence of Bailey County, and error in Kinney County
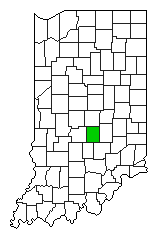
Corrected the error in the official results for Johnson County, Indiana
There exists a 1,000 vote data error in the official and final election results for Indiana United States Representative District 9 as published by the Indiana Secretary of State. The error is in the vote total for Libertarian candidate Ralph Mike Frey in Johnson County. The total tabulated by the Indiana Secretary of State of 1,930 votes is actually only 930 votes as confirmed by the Johnson County Clerk. The Johnson County report, General Election November 4, 2014 Summary Report, is final and official and deemed the accurate count. The 2014 U.S. House dataset has been updated with the correction.
The data tables on the Atlas have been upgraded to provide more interactive features, including immediate multi-column sort, column filters, map highlights, and more. An interactive example of the 2012 Gubernatorial Election result is shown below:
New Features:
Sort the table on a given column directly by clicking the arrows in the header row cell (one click, sorts ascending, two clicks sorts descending, third click removes the sort).
Sort on multiple columns by holding down shift key when clicking on the header sort cell.
Mouse over on a row highlights the row and the corresponding shape boundary on the map.
Mouse over on a map highlights the shape boundary and the corresponding row in the table
Click on the mini map at left of each row goes to the summary data page with candidate result details and maps.
Click on the name at left of each row goes to the next-level down data table
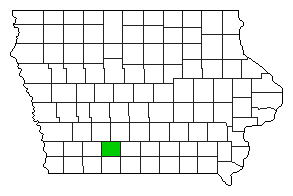
Union County, IA 2014 General Election Result for Governor
Candidate
IA SoS Result
Union County Result
Difference
Total
2,062
4,286
-2,224
Terry Bradstad (R)
1,388
2,690
-1,302
Jack Hatch (D)
560
1,407
-847
Lee Deakins Hieb (L)
68
105
-37
Others
56
84
-28
Interestingly, other statewide offices are correct, only the race for Governor is in error. The corrected data have been updated in the Atlas database (Union County Gubernatorial Result page).
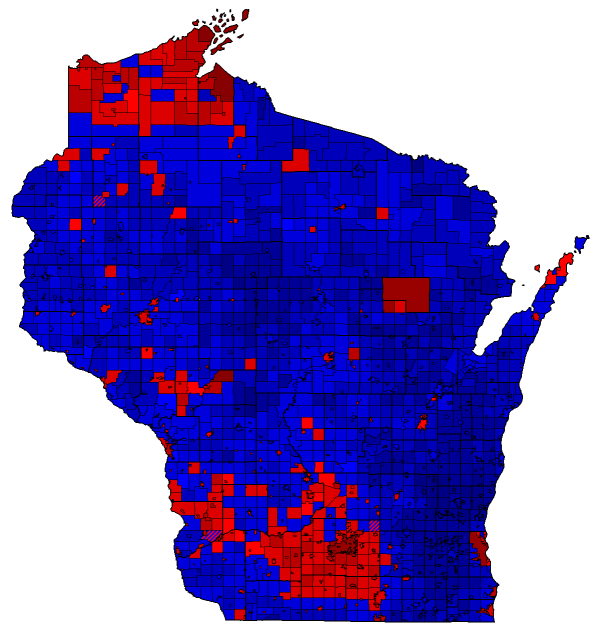
Wisconsin 2014 Gubernatorial Election Result Map by Municipality
The 2014 General Election result map for Governor in the state of Wisconsin tabulated by Municipality is complete (shown at right). The contest was between incumbent Republican Governor Scott Walker and Democratic candidate Mary Burke (results page). The final statewide percentages are almost an exact repeat of the 2010 contest between Scott Walker and Tom Barrett (results page). The 2014 result was Walker over Burke 52.26% to 46.59% and the 2010 result was Walker over Barrett 52.25% to 46.48%!
At the county and municipality level, the results are quite similar as well. Walker wins 1,508 municipalities with an average margin of 272 votes (median margin of 93 votes) to Burke’s 381 with an average margin of 715 votes and a median margin of 41 votes (the Democratic data are dominated by two municipalities – Milwaukee City with a margin of 109,679 and Madison City with a margin of 70,846). The largest Republican margin is in Brookfield City (Waukesha County) with 9,929 votes. Seven municipalities are ties. In 2010, Walker won 1,480 municipalities to Barrett’s 399 with 15 ties. The largest swings were in the north-central part of the state with Iron and Taylor Counties leading the Republican Swing percentage while the south and north-west portions of the state had Democratic Swings. Detailed maps are available here.
Data for the 2014 General Election for U.S. Senate and Governor are all updated to certified results (except for Tennessee Governor, where the data is final, awaiting certification in January). Datasets for U.S. Senate, Governor, and U.S. House of Representatives are all updated and available on the store page.
In the 2014 General Election contest for U.S. Senate in Alabama, more than 360,000 voters left their ballot blank. The race featured incumbent Senator Jeff Session running for re-election without a named opponent printed on the ballot. The ballot did include, however, an option to vote for a write-in a candidate. On November 24, the Alabama Secretary of State certified the 2014 General Election Results, publishing the final tally of the vote as 795,606 for Republican Jeff Sessions (97.25%) and 22,484 write-ins (2.75%). The county-level result, shown at right, is a solid “>90%” in every county, with exception of Macon County, where the write-in tally just cleared 10%. Full results are available here.
Looking deeper into the data though, its clear that most voters that did not want to vote for the incumbent Senator simply left their ballots blank.
Alabama 2014 US Senate Vote Dropoff
The drop-off vote from Governor to U.S. Senate (the difference in total vote between the two contests) is 362,323 votes (30.6%). The total Republican Vote for Jeff Sessions in the U.S. Senate contest is only 5.7% more than Republican Robert Bentley received in the Gubernatorial vote – 795,606 vs. 750,231, a difference of 43,375 – full Gubernatorial results can be seen here. At the county level, the drop-off varies considerably, from the smallest drop-off of 10.4% in Blount County to the largest of 80.5% in Greene County. A map of the results can be seen at right.
Map Key
>10%
>20%
>30%
>40%
>50%
>60%
>70%
>80%
Dropoff
Alabama 2014 Gubernatorial Vote for Republican
In one example, Macon County, Democratic Gubernatorial candidate Parker Griffith received 4,830 votes (85.3%) to Robert Bentley’s 829 (14.6%) and three write-in votes – a total of 5,662 votes. In the U.S. Senate contest, Jeff Sessions, picked up 1,133 votes to 127 write-ins. The number of blank votes in the U.S. Senate race relative to the Governor’s race 4,402 votes (77.8%).
Predictably, the drop-off correlates with the percentage of vote for Republican, as shown in the map to the right. The sharpness of the magnitude of this correlation may be, in part, due to the existence of the straight-party option. As seen in this sample ballot, the voter can choose Alabama Democratic Party, Alabama Independence Party, or Alabama Republican Party at the very top of the ballot under “Straight Party Voting”. If the voter chooses the “Alabama Democratic Party” option, no vote for US Senate is cast.
The residents of Shannon County, SD have voted to change the name of the county to Oglala Lakota County. The vote tally from the November 4th election is
Yes
2,161
80.4%
No
526
19.6%
The process has several more steps until the name change becomes official, including a joint resolution of the South Dakota Legislature followed by a proclamation from the governor. The name change then becomes official on the first day of the first month following the proclamation. South Dakota Statute 7-1-71 and Statute 7-1-72 state:
7-1-71. Legislative resolution to change name. The Governor at the next convention of the annual session of the State Legislature shall communicate the result of an election held pursuant to § 7-1-69 in such county to the presiding officer of each branch of the Legislature, and thereupon the Legislature shall designate by joint resolution the new name of such county.
7-1-72. Governor’s proclamation of new county name. Upon the designation made by the Legislature pursuant to § 7-1-71, the Governor shall publicly proclaim the result of the election held pursuant to § 7-1-69 and of the new name of the county. The new name of such county shall be in full force and effect on the first day of the month following such proclamation by the Governor.
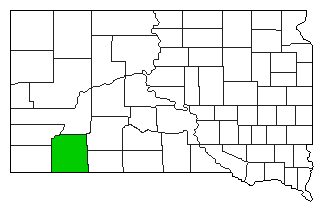
Shannon County Change of County Name Precinct Results Map
The vote for the “Shannon County Change of County Name” took place on the same day as the 2014 General Election, but on a separate paper ballot. A sample ballot with question wording may be seen here.
The map at the right shows the full Shannon County precinct result for the vote. All precincts voted in favor of the change except for Cuny Table, the precinct with the fewest votes in the northwest corner, where they voted against the change 22 to 19. Five precincts voted with more than 80% in favor.
Map Key
>50%
>60%
>70%
>80%
Yes
No
The map key is shown at the right. The table below show the precinct-level data from the vote.
Shannon County Name Change Precinct Results
Precinct Name
Yes Vote
No Vote
Yes %
No %
Total
2,161
526
80%
20%
Batesland
69
43
62%
38%
Cuny Table
19
22
46%
54%
Kyle
299
69
81%
19%
Manderson
150
27
85%
15%
Oglala
336
90
79%
21%
Pine Ridge 1
538
116
82%
18%
Pine Ridge 3
375
75
83%
17%
Porcupine
322
62
84%
16%
Rockyford
53
22
71%
29%
Shannon County was Barack Obama’s best county in the 2012 General Election (see statistics page), where he won with 93.4% of the vote. Mitt Romney only managed 6.0%. Full 2012 Shannon County presidential results are available here.