Bellwether States and Counties - 1960 through 1996
Two states and eight counties have voted for the winning candidate in every election from 1960 through 1996. These are shown below:
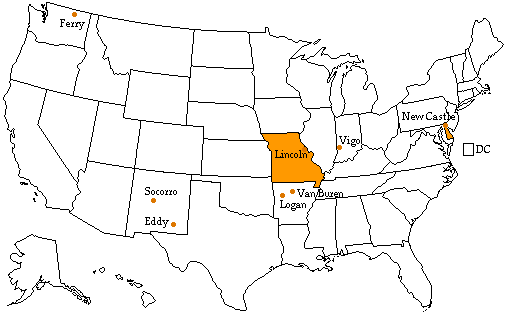
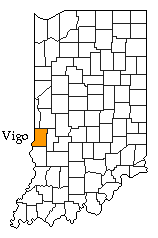
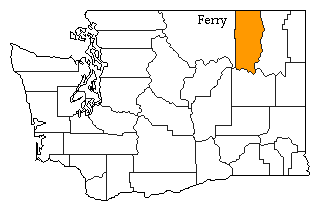
For 2000 and 2004, the state of Delaware and its dominant county, New Castle, have lost their bellwether status having voting solidly Democratic in the 2004 election (5.1% and 12.3% respectively above the national result). Also, Socorro, NM loses its bellwether status, having voted for Kerry in 2004. Arguably, Eddy, NM and Ferry, WA may also no longer vote in bellwether fashion as the result in each county differed from the national result by more than 9%. The most solid bellwether is Vigo, IN having maintained an average difference relative to the national result of 0.9 percentage points for all Democratic and Replubican Candidates since 1960. The results for the 1960 - 1996 bellwethers are shown below.
Results NationwideNational
| Year | D | R | I | Margin | %Margin | Dem. | Rep. | Ind. | Oth. |
| 2004 | 2 | 1 | - | 3,012,457 | 2.46% | 48.26% | 50.73% | 0.00% | 1.01% |
| 2000 | 1 | 2 | 3 | 547,398 | 0.52% | 48.38% | 47.87% | 2.74% | 1.02% |
| 1996 | 1 | 2 | 3 | 8,201,370 | 8.52% | 49.23% | 40.72% | 8.40% | 1.65% |
| 1992 | 1 | 2 | 3 | 5,805,256 | 5.56% | 43.01% | 37.45% | 18.91% | 0.64% |
| 1988 | 2 | 1 | - | 7,077,103 | 7.73% | 45.65% | 53.37% | 0.00% | 0.98% |
| 1984 | 2 | 1 | - | 16,878,120 | 18.22% | 40.56% | 58.77% | 0.00% | 0.67% |
| 1980 | 2 | 1 | 3 | 8,423,115 | 9.74% | 41.01% | 50.75% | 6.61% | 1.63% |
| 1976 | 1 | 2 | - | 1,683,247 | 2.06% | 50.08% | 48.01% | 0.00% | 1.91% |
| 1972 | 2 | 1 | - | 17,995,488 | 23.15% | 37.52% | 60.67% | 0.00% | 1.80% |
| 1968 | 2 | 1 | 3 | 511,944 | 0.70% | 42.72% | 43.42% | 13.53% | 0.33% |
| 1964 | 1 | 2 | 3 | 15,953,286 | 22.58% | 61.05% | 38.47% | 0.30% | 0.18% |
| 1960 | 1 | 2 | 3 | 112,827 | 0.16% | 49.72% | 49.55% | 0.42% | 0.32% |
Results for Bellwether States
Delaware:
| Year | D | R | I | Margin | %Margin | Results for Delaware | - | Difference from National | ||||||
| Dem. | Rep. | Ind. | Oth. | Dem. | Rep. | Ind. | Oth. | |||||||
| 2004 | 1 | 2 | - | 28,492 | 7.59% | 53.34% | 45.74% | 0.00% | 0.92% | 5.07% | -4.98% | 0.00% | -0.09% | |
| 2000 | 1 | 2 | 3 | 42,780 | 13.06% | 54.96% | 41.90% | 2.54% | 0.60% | 6.58% | -5.96% | -0.20% | -0.42% | |
| 1996 | 1 | 2 | 3 | 41,293 | 15.23% | 51.78% | 36.54% | 10.59% | 1.09% | 2.54% | -4.17% | 2.20% | -0.57% | |
| 1992 | 1 | 2 | 3 | 23,741 | 8.19% | 43.51% | 35.31% | 20.44% | 0.74% | 0.50% | -2.13% | 1.53% | 0.10% | |
| 1988 | 2 | 1 | - | 30,992 | 12.40% | 43.48% | 55.88% | 0.00% | 0.64% | -2.17% | 2.51% | 0.00% | -0.34% | |
| 1984 | 2 | 1 | - | 50,534 | 19.85% | 39.93% | 59.78% | 0.00% | 0.29% | -0.62% | 1.01% | 0.00% | -0.38% | |
| 1980 | 2 | 1 | 3 | 5,498 | 2.33% | 44.87% | 47.21% | 6.91% | 1.01% | 3.86% | -3.54% | 0.30% | -0.62% | |
| 1976 | 1 | 2 | - | 12,765 | 5.41% | 51.98% | 46.57% | 0.00% | 1.44% | 1.91% | -1.44% | 0.00% | -0.47% | |
| 1972 | 2 | 1 | - | 48,074 | 20.41% | 39.18% | 59.60% | 0.00% | 1.22% | 1.66% | -1.08% | 0.00% | -0.58% | |
| 1968 | 2 | 1 | 3 | 7,520 | 3.51% | 41.61% | 45.12% | 13.28% | 0.00% | -1.11% | 1.70% | -0.25% | -0.33% | |
| 1964 | 1 | 2 | 0 | 44,626 | 22.17% | 60.95% | 38.78% | 0.00% | 0.27% | -0.10% | 0.31% | -0.30% | 0.09% | |
| 1960 | 1 | 2 | 0 | 3,217 | 1.64% | 50.63% | 49.00% | 0.00% | 0.37% | 0.92% | -0.55% | -0.42% | 0.05% | |
Missouri:
| Year | D | R | I | Margin | %Margin | Results for Missouri | - | Difference from National | ||||||
| Dem. | Rep. | Ind. | Oth. | Dem. | Rep. | Ind. | Oth. | |||||||
| 2004 | 2 | 1 | - | 196,542 | 7.20% | 46.10% | 53.30% | 0.00% | 0.60% | -2.16% | 2.57% | 0.00% | -0.41% | |
| 2000 | 2 | 1 | 3 | 78,786 | 3.34% | 47.08% | 50.42% | 1.63% | 0.86% | -1.30% | 2.56% | -1.10% | -0.15% | |
| 1996 | 1 | 2 | 3 | 135,919 | 6.30% | 47.54% | 41.24% | 10.06% | 1.16% | -1.69% | 0.53% | 1.67% | -0.50% | |
| 1992 | 1 | 2 | 3 | 242,714 | 10.15% | 44.07% | 33.92% | 21.69% | 0.33% | 1.06% | -3.53% | 2.78% | -0.31% | |
| 1988 | 2 | 1 | - | 83,334 | 3.98% | 47.85% | 51.83% | 0.00% | 0.32% | 2.20% | -1.54% | 0.00% | -0.66% | |
| 1984 | 2 | 1 | - | 425,605 | 20.05% | 39.98% | 60.02% | 0.00% | 0.00% | -0.58% | 1.25% | 0.00% | -0.67% | |
| 1980 | 2 | 1 | 3 | 142,999 | 6.81% | 44.35% | 51.16% | 3.71% | 0.79% | 3.33% | 0.41% | -2.90% | -0.84% | |
| 1976 | 1 | 2 | - | 70,944 | 3.63% | 51.10% | 47.47% | 0.00% | 1.42% | 1.03% | -0.54% | 0.00% | -0.49% | |
| 1972 | 2 | 1 | - | 455,527 | 24.59% | 37.71% | 62.29% | 0.00% | 0.00% | 0.18% | 1.62% | 0.00% | -1.80% | |
| 1968 | 2 | 1 | 3 | 20,488 | 1.13% | 43.74% | 44.87% | 11.39% | 0.00% | 1.02% | 1.45% | -2.13% | -0.33% | |
| 1964 | 1 | 2 | 0 | 510,809 | 28.10% | 64.05% | 35.95% | 0.00% | 0.00% | 3.00% | -2.52% | -0.30% | -0.18% | |
| 1960 | 1 | 2 | 0 | 9,980 | 0.52% | 50.26% | 49.74% | 0.00% | 0.00% | 0.54% | 0.19% | -0.42% | -0.32% | |
Results for Bellwether Counties
Logan, AR:
| Year | D | R | I | Margin | %Margin | Results for Logan, AR | - | Difference from National | ||||||
| Dem. | Rep. | Ind. | Oth. | Dem. | Rep. | Ind. | Oth. | |||||||
| 2004 | 2 | 1 | - | 1,715 | 20.06% | 39.31% | 59.36% | 0.00% | 1.33% | -8.96% | 8.64% | 0.00% | 0.32% | |
| 2000 | 2 | 1 | 4 | 1,204 | 14.87% | 40.55% | 55.42% | 1.53% | 2.50% | -7.83% | 7.56% | -1.20% | 1.48% | |
| 1996 | 1 | 2 | 3 | 866 | 10.82% | 47.89% | 37.07% | 13.10% | 1.95% | -1.35% | -3.65% | 4.70% | 0.30% | |
| 1992 | 1 | 2 | 3 | 587 | 6.76% | 45.99% | 39.23% | 14.04% | 0.74% | 2.98% | 1.78% | -4.86% | 0.10% | |
| 1988 | 2 | 1 | - | 949 | 27.08% | 35.79% | 62.87% | 0.00% | 1.34% | -9.86% | 9.50% | 0.00% | 0.36% | |
| 1984 | 2 | 1 | - | 2,457 | 27.39% | 35.75% | 63.14% | 0.00% | 1.11% | -4.81% | 4.37% | 0.00% | 0.45% | |
| 1980 | 2 | 1 | 3 | 413 | 4.63% | 45.98% | 50.61% | 1.86% | 1.55% | 4.96% | -0.14% | -4.75% | -0.08% | |
| 1976 | 1 | 2 | - | 2,404 | 28.98% | 64.06% | 35.07% | 0.00% | 0.87% | 13.98% | -12.94% | 0.00% | -1.05% | |
| 1972 | 2 | 1 | - | 3,008 | 43.28% | 28.14% | 71.42% | 0.00% | 0.43% | -9.38% | 10.75% | 0.00% | -1.37% | |
| 1968 | 3 | 1 | 2 | 181 | 2.79% | 30.74% | 36.02% | 33.24% | 0.00% | -11.98% | -7.40% | 19.71% | -0.33% | |
| 1964 | 1 | 2 | 0 | 1,339 | 22.71% | 61.13% | 38.42% | 0.00% | 0.46% | 0.07% | -0.05% | -0.30% | 0.28% | |
| 1960 | 1 | 2 | 0 | 622 | 13.06% | 55.33% | 42.28% | 0.00% | 2.39% | 5.62% | -7.28% | -0.42% | 2.08% | |
Van Buren, AR:
| Year | D | R | I | Margin | %Margin | Results for Van Buren, AR | - | Difference from National | ||||||
| Dem. | Rep. | Ind. | Oth. | Dem. | Rep. | Ind. | Oth. | |||||||
| 2004 | 2 | 1 | - | 678 | 9.19% | 44.89% | 54.08% | 0.00% | 1.03% | -3.38% | 3.36% | 0.00% | 0.02% | |
| 2000 | 2 | 1 | 3 | 283 | 4.05% | 45.85% | 49.90% | 2.19% | 2.06% | -2.54% | 2.03% | -0.54% | 1.05% | |
| 1996 | 1 | 2 | 3 | 1,176 | 17.29% | 51.77% | 34.48% | 12.20% | 1.54% | 2.54% | -6.23% | 3.81% | -0.11% | |
| 1992 | 1 | 2 | 3 | 1,207 | 16.40% | 51.88% | 35.48% | 12.06% | 0.57% | 8.88% | -1.96% | -6.84% | -0.07% | |
| 1988 | 2 | 1 | - | 955 | 15.38% | 41.99% | 57.37% | 0.00% | 0.64% | -3.66% | 4.00% | 0.00% | -0.34% | |
| 1984 | 2 | 1 | - | 1,531 | 22.99% | 37.98% | 60.97% | 0.00% | 1.05% | -2.58% | 2.20% | 0.00% | 0.38% | |
| 1980 | 2 | 1 | 3 | 122 | 1.94% | 47.17% | 49.11% | 2.43% | 1.29% | 6.16% | -1.64% | -4.18% | -0.34% | |
| 1976 | 1 | 2 | - | 2,380 | 42.29% | 71.14% | 28.86% | 0.00% | 0.00% | 21.07% | -19.16% | 0.00% | -1.91% | |
| 1972 | 2 | 1 | - | 1,028 | 24.27% | 37.64% | 61.91% | 0.00% | 0.45% | 0.11% | 1.24% | 0.00% | -1.35% | |
| 1968 | 3 | 1 | 2 | 101 | 2.73% | 31.07% | 35.83% | 33.10% | 0.00% | -11.65% | -7.59% | 19.57% | -0.33% | |
| 1964 | 1 | 2 | 0 | 784 | 23.39% | 61.28% | 37.89% | 0.00% | 0.84% | 0.22% | -0.58% | -0.30% | 0.66% | |
| 1960 | 1 | 2 | 0 | 149 | 6.57% | 51.08% | 44.51% | 0.00% | 4.41% | 1.36% | -5.04% | -0.42% | 4.10% | |
New Castle, DE:
| Year | D | R | I | Margin | %Margin | Results for New Castle, DE | - | Difference from National | ||||||
| Dem. | Rep. | Ind. | Oth. | Dem. | Rep. | Ind. | Oth. | |||||||
| 2004 | 1 | 2 | - | 53,100 | 21.99% | 60.52% | 38.54% | 0.00% | 0.94% | 12.26% | -12.19% | 0.00% | -0.07% | |
| 2000 | 1 | 2 | 3 | 48,952 | 22.98% | 59.86% | 36.88% | 2.71% | 0.55% | 11.48% | -10.98% | -0.03% | -0.47% | |
| 1996 | 1 | 2 | 3 | 37,894 | 21.11% | 55.05% | 33.94% | 9.88% | 1.12% | 5.81% | -6.77% | 1.49% | -0.53% | |
| 1992 | 1 | 2 | 3 | 25,205 | 12.81% | 46.50% | 33.69% | 19.09% | 0.72% | 3.49% | -3.76% | 0.19% | 0.08% | |
| 1988 | 2 | 1 | - | 13,440 | 7.77% | 45.75% | 53.52% | 0.00% | 0.73% | 0.10% | 0.14% | 0.00% | -0.25% | |
| 1984 | 2 | 1 | - | 26,084 | 14.57% | 42.57% | 57.14% | 0.00% | 0.29% | 2.02% | -1.63% | 0.00% | -0.38% | |
| 1980 | 2 | 1 | 3 | 1 | 0.00% | 45.66% | 45.66% | 7.62% | 1.07% | 4.64% | -5.09% | 1.00% | -0.55% | |
| 1976 | 1 | 2 | - | 7,447 | 4.37% | 51.38% | 47.01% | 0.00% | 1.61% | 1.31% | -1.00% | 0.00% | -0.30% | |
| 1972 | 2 | 1 | - | 30,491 | 17.63% | 40.58% | 58.21% | 0.00% | 1.21% | 3.06% | -2.46% | 0.00% | -0.60% | |
| 1968 | 2 | 1 | 3 | 1,546 | 0.99% | 43.77% | 44.76% | 11.46% | 0.00% | 1.05% | 1.34% | -2.06% | -0.33% | |
| 1964 | 1 | 2 | 0 | 36,985 | 25.18% | 62.46% | 37.28% | 0.00% | 0.25% | 1.41% | -1.19% | -0.30% | 0.08% | |
| 1960 | 1 | 2 | 0 | 4,080 | 2.85% | 51.31% | 48.46% | 0.00% | 0.23% | 1.60% | -1.09% | -0.42% | -0.09% | |
Vigo, IN:
| Year | D | R | I | Margin | %Margin | Results for Vigo, IN | - | Difference from National | ||||||
| Dem. | Rep. | Ind. | Oth. | Dem. | Rep. | Ind. | Oth. | |||||||
| 2004 | 2 | 1 | - | 2,562 | 6.45% | 46.36% | 52.81% | 0.00% | 0.83% | -1.90% | 2.08% | 0.00% | -0.18% | |
| 2000 | 2 | 1 | 5 | 451 | 1.24% | 48.50% | 49.74% | 0.44% | 1.32% | 0.11% | 1.88% | -2.30% | 0.31% | |
| 1996 | 1 | 2 | 3 | 2,223 | 5.77% | 46.69% | 40.91% | 11.71% | 0.69% | -2.55% | 0.20% | 3.31% | -0.96% | |
| 1992 | 1 | 2 | 3 | 2,216 | 5.26% | 42.81% | 37.56% | 19.31% | 0.32% | -0.19% | 0.11% | 0.40% | -0.32% | |
| 1988 | 2 | 1 | - | 2,737 | 6.63% | 46.48% | 53.11% | 0.00% | 0.42% | 0.83% | -0.27% | 0.00% | -0.56% | |
| 1984 | 2 | 1 | - | 7,830 | 17.41% | 40.98% | 58.39% | 0.00% | 0.63% | 0.42% | -0.39% | 0.00% | -0.04% | |
| 1980 | 2 | 1 | 3 | 4,872 | 10.47% | 41.40% | 51.87% | 5.34% | 1.39% | 0.38% | 1.12% | -1.27% | -0.23% | |
| 1976 | 1 | 2 | - | 1,129 | 2.32% | 50.78% | 48.46% | 0.00% | 0.76% | 0.70% | 0.45% | 0.00% | -1.15% | |
| 1972 | 2 | 1 | - | 10,832 | 22.13% | 38.60% | 60.73% | 0.00% | 0.67% | 1.08% | 0.05% | 0.00% | -1.13% | |
| 1968 | 2 | 1 | 3 | 486 | 1.04% | 43.56% | 44.60% | 11.54% | 0.29% | 0.84% | 1.18% | -1.98% | -0.04% | |
| 1964 | 1 | 2 | 0 | 8,605 | 18.41% | 59.05% | 40.64% | 0.00% | 0.31% | -2.00% | 2.17% | -0.30% | 0.13% | |
| 1960 | 1 | 2 | 0 | 165 | 0.33% | 50.03% | 49.70% | 0.00% | 0.27% | 0.32% | 0.15% | -0.42% | -0.05% | |
Lincoln, MO:
| Year | D | R | I | Margin | %Margin | Results for Lincoln, MO | - | Difference from National | ||||||
| Dem. | Rep. | Ind. | Oth. | Dem. | Rep. | Ind. | Oth. | |||||||
| 2004 | 2 | 1 | - | 2,948 | 14.86% | 42.18% | 57.04% | 0.00% | 0.78% | -6.08% | 6.31% | 0.00% | -0.23% | |
| 2000 | 2 | 1 | 3 | 1,588 | 9.98% | 43.74% | 53.72% | 1.41% | 1.12% | -4.64% | 5.86% | -1.33% | 0.11% | |
| 1996 | 1 | 2 | 3 | 747 | 5.92% | 44.75% | 38.83% | 14.92% | 1.50% | -4.48% | -1.88% | 6.52% | -0.15% | |
| 1992 | 1 | 2 | 3 | 1,735 | 13.59% | 42.72% | 29.13% | 27.98% | 0.17% | -0.29% | -8.32% | 9.08% | -0.47% | |
| 1988 | 2 | 1 | - | 700 | 7.04% | 46.34% | 53.38% | 0.00% | 0.28% | 0.69% | 0.01% | 0.00% | -0.70% | |
| 1984 | 2 | 1 | - | 2,847 | 30.20% | 34.90% | 65.10% | 0.00% | 0.00% | -5.66% | 6.33% | 0.00% | -0.67% | |
| 1980 | 2 | 1 | 3 | 853 | 9.14% | 44.03% | 53.17% | 1.95% | 0.86% | 3.01% | 2.42% | -4.66% | -0.77% | |
| 1976 | 1 | 2 | - | 892 | 10.96% | 54.95% | 43.99% | 0.00% | 1.06% | 4.88% | -4.02% | 0.00% | -0.86% | |
| 1972 | 2 | 1 | - | 2,343 | 29.62% | 35.19% | 64.81% | 0.00% | 0.00% | -2.33% | 4.14% | 0.00% | -1.80% | |
| 1968 | 2 | 1 | 3 | 43 | 0.56% | 41.21% | 41.78% | 17.01% | 0.00% | -1.51% | -1.64% | 3.49% | -0.33% | |
| 1964 | 1 | 2 | 0 | 2,722 | 37.47% | 68.74% | 31.26% | 0.00% | 0.00% | 7.68% | -7.21% | -0.30% | -0.18% | |
| 1960 | 1 | 2 | 0 | 322 | 4.43% | 52.22% | 47.78% | 0.00% | 0.00% | 2.50% | -1.77% | -0.42% | -0.32% | |
Socorro, NM:
| Year | D | R | I | Margin | %Margin | Results for Socorro, NM | - | Difference from National | ||||||
| Dem. | Rep. | Ind. | Oth. | Dem. | Rep. | Ind. | Oth. | |||||||
| 2004 | 1 | 2 | - | 329 | 4.19% | 51.27% | 47.08% | 0.00% | 1.66% | 3.00% | -3.65% | 0.00% | 0.64% | |
| 2000 | 1 | 2 | 3 | 121 | 1.77% | 48.26% | 46.48% | 4.09% | 1.17% | -0.13% | -1.38% | 1.35% | 0.16% | |
| 1996 | 1 | 2 | 3 | 1,059 | 16.64% | 53.02% | 36.38% | 7.15% | 3.46% | 3.78% | -4.34% | -1.25% | 1.80% | |
| 1992 | 1 | 2 | 3 | 722 | 11.86% | 47.77% | 35.91% | 15.08% | 1.25% | 4.76% | -1.54% | -3.83% | 0.61% | |
| 1988 | 2 | 1 | - | 154 | 2.48% | 47.61% | 50.09% | 0.00% | 2.30% | 1.97% | -3.28% | 0.00% | 1.32% | |
| 1984 | 2 | 1 | - | 862 | 14.25% | 42.01% | 56.27% | 0.00% | 1.72% | 1.46% | -2.51% | 0.00% | 1.05% | |
| 1980 | 2 | 1 | 3 | 459 | 8.47% | 41.05% | 49.52% | 7.14% | 2.29% | 0.04% | -1.23% | 0.53% | 0.66% | |
| 1976 | 1 | 2 | - | 341 | 6.90% | 52.76% | 45.86% | 0.00% | 1.38% | 2.69% | -2.15% | 0.00% | -0.54% | |
| 1972 | 2 | 1 | - | 664 | 14.04% | 42.16% | 56.19% | 0.00% | 1.65% | 4.63% | -4.48% | 0.00% | -0.15% | |
| 1968 | 2 | 1 | 3 | 359 | 8.38% | 43.68% | 52.07% | 4.04% | 0.21% | 0.96% | 8.65% | -9.49% | -0.12% | |
| 1964 | 1 | 2 | 0 | 623 | 14.90% | 57.33% | 42.43% | 0.00% | 0.24% | -3.72% | 3.96% | -0.30% | 0.06% | |
| 1960 | 1 | 2 | 0 | 531 | 12.86% | 56.37% | 43.51% | 0.00% | 0.12% | 6.65% | -6.04% | -0.42% | -0.19% | |
Eddy, NM:
| Year | D | R | I | Margin | %Margin | Results for Eddy, NM | - | Difference from National | ||||||
| Dem. | Rep. | Ind. | Oth. | Dem. | Rep. | Ind. | Oth. | |||||||
| 2004 | 2 | 1 | - | 6,388 | 31.51% | 33.94% | 65.46% | 0.00% | 0.60% | -14.32% | 14.73% | 0.00% | -0.41% | |
| 2000 | 2 | 1 | 3 | 3,227 | 18.14% | 39.96% | 58.10% | 1.44% | 0.49% | -8.42% | 10.24% | -1.30% | -0.52% | |
| 1996 | 1 | 2 | 3 | 425 | 2.24% | 47.16% | 44.92% | 6.83% | 1.09% | -2.08% | 4.21% | -1.57% | -0.56% | |
| 1992 | 1 | 2 | 3 | 96 | 0.53% | 40.70% | 40.18% | 18.84% | 0.27% | -2.30% | 2.73% | -0.06% | -0.37% | |
| 1988 | 2 | 1 | - | 1,261 | 6.80% | 46.10% | 52.90% | 0.00% | 1.00% | 0.45% | -0.47% | 0.00% | 0.02% | |
| 1984 | 2 | 1 | - | 4,446 | 22.96% | 38.03% | 60.99% | 0.00% | 0.99% | -2.53% | 2.21% | 0.00% | 0.32% | |
| 1980 | 2 | 1 | 3 | 2,789 | 16.07% | 40.49% | 56.55% | 1.88% | 1.08% | -0.53% | 5.80% | -4.73% | -0.54% | |
| 1976 | 1 | 2 | - | 1,375 | 8.14% | 53.73% | 45.59% | 0.00% | 0.68% | 3.66% | -2.42% | 0.00% | -1.23% | |
| 1972 | 2 | 1 | - | 4,881 | 31.81% | 32.84% | 64.65% | 0.00% | 2.51% | -4.68% | 3.98% | 0.00% | 0.71% | |
| 1968 | 2 | 1 | 3 | 1,100 | 7.30% | 40.44% | 47.74% | 11.09% | 0.72% | -2.28% | 4.32% | -2.43% | 0.39% | |
| 1964 | 1 | 2 | 0 | 4,469 | 24.78% | 62.20% | 37.42% | 0.00% | 0.38% | 1.15% | -1.05% | -0.30% | 0.20% | |
| 1960 | 1 | 2 | 0 | 721 | 4.30% | 51.89% | 47.59% | 0.00% | 0.52% | 2.17% | -1.96% | -0.42% | 0.20% | |
Ferry, WA:
| Year | D | R | I | Margin | %Margin | Results for Ferry, WA | - | Difference from National | ||||||
| Dem. | Rep. | Ind. | Oth. | Dem. | Rep. | Ind. | Oth. | |||||||
| 2004 | 2 | 1 | - | 818 | 24.46% | 35.92% | 60.38% | 0.00% | 3.71% | -12.35% | 9.65% | 0.00% | 2.70% | |
| 2000 | 2 | 1 | 3 | 964 | 31.73% | 30.68% | 62.41% | 3.85% | 3.06% | -17.71% | 14.54% | 1.12% | 2.05% | |
| 1996 | 1 | 2 | 3 | 106 | 3.76% | 42.49% | 38.73% | 14.48% | 4.30% | -6.74% | -1.99% | 6.09% | 2.64% | |
| 1992 | 1 | 2 | 3 | 190 | 7.43% | 37.66% | 30.23% | 29.80% | 2.31% | -5.34% | -7.22% | 10.89% | 1.67% | |
| 1988 | 1 | 1 | - | 0 | 0.00% | 48.10% | 48.10% | 0.00% | 3.81% | 2.45% | -5.28% | 0.00% | 2.83% | |
| 1984 | 2 | 1 | - | 297 | 13.44% | 42.31% | 55.75% | 0.00% | 1.95% | 1.75% | -3.03% | 0.00% | 1.28% | |
| 1980 | 2 | 1 | 3 | 306 | 14.57% | 38.19% | 52.76% | 6.05% | 3.00% | -2.82% | 2.01% | -0.56% | 1.37% | |
| 1976 | 1 | 2 | - | 38 | 2.25% | 48.11% | 45.86% | 0.00% | 6.03% | -1.97% | -2.15% | 0.00% | 4.11% | |
| 1972 | 2 | 1 | - | 255 | 16.70% | 36.67% | 53.37% | 0.00% | 9.95% | -0.85% | -7.30% | 0.00% | 8.15% | |
| 1968 | 2 | 1 | 3 | 12 | 0.87% | 42.97% | 43.84% | 13.12% | 0.07% | 0.25% | 0.42% | -0.40% | -0.26% | |
| 1964 | 1 | 2 | 0 | 405 | 27.76% | 63.81% | 36.05% | 0.00% | 0.14% | 2.76% | -2.42% | -0.30% | -0.04% | |
| 1960 | 1 | 2 | 0 | 298 | 19.28% | 59.57% | 40.30% | 0.00% | 0.13% | 9.86% | -9.25% | -0.42% | -0.19% | |
County Maps
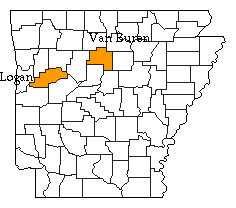 |  |
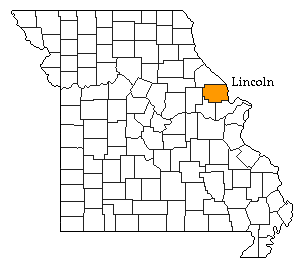 | 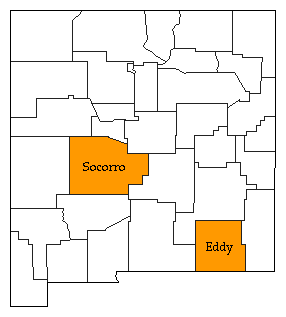 |
 |  |
