Predictions2012 Presidential Republican Primary Polls - CA ResultsPolls
Note: The Google advertisement links below may advocate political positions that this site does not endorse.

California Polls (Aggregate = Strong Romney for 3-poll average)

Candidate Avg. #Wins Delegates Poll Graph Election Details
Romney 43% 3 169pie
Election Date: 2012-06-05
Election Type: Primary
Eligable Voters: Closed
Delegates Total: 172
Delegates Awarded: 169
Apportion Method: WTAD/S
Santorum 23% 0 0
Gingrich 13% 0 0
Paul 10% 0 0
Other 1% 0 0
-Undecided 10% 0 0

 Three-Poll Rolling Average
 Rolling Average Poll Graph

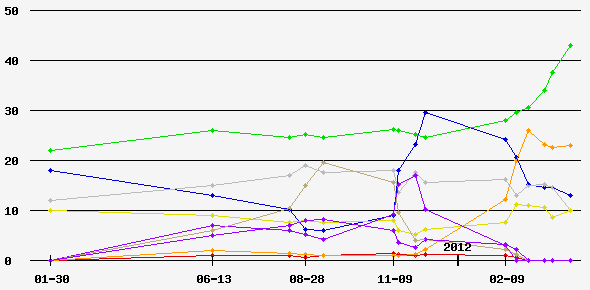
 Delegates Awarded Prior to this Contest: 1,489 (61.5%)

 Projected Delegate Allocation Prior to this Contest:
Prior Delegate Allocation Graph

DatePoll SourceLead G R P S C P B OthUnd MOE Sample#C
2012-04-02Survey USAR+2112%44%12%23%0%0%0%1%8%5%439 L0
2012-03-19LA TimesR+1912%42%10%23%0%0%0%0%14%3%1,500 R0
2012-03-12RasmussenR+2015%43%8%23%0%0%0%3%8%4%750 L0
2012-02-28Public Policy Institute of CAR+617%28%8%22%0%0%0%3%22%7%281 L0
2012-02-18Field Research CorporationR+612%31%16%25%0%0%0%0%16%6%220 R0
2012-02-09Survey USAR+217%33%9%31%0%0%0%3%7%5%479 L0
2011-12-05Public Policy Institute of CAG+833%25%9%4%0%4%7%2%16%2%2,003 L0
2011-11-27Field Research CorporationR+323%26%5%2%9%3%3%3%26%6%330 L0
2011-11-13Public Policy PollingG+1033%23%5%1%22%6%3%2%5%6%316 L0
2011-11-09LA TimesR+714%27%6%1%20%3%2%5%22%2%1,500 L0
2011-09-12Field Research CorporationR+87%28%7%1%4%20%6%13%14%6%333 R0
2011-08-28LA TimesTie6%24%11%1%4%24%10%2%18%3%1,508 L0
2011-08-15New SourceR+75%22%5%1%5%15%9%17%21%6%293 L0
2011-06-13Field Research CorporationR+228%30%8%2%7%6%5%16%18%6%322 R0
2011-01-30Public Policy PollingR+418%22%10%0%0%0%0%38%12%5%403 L0


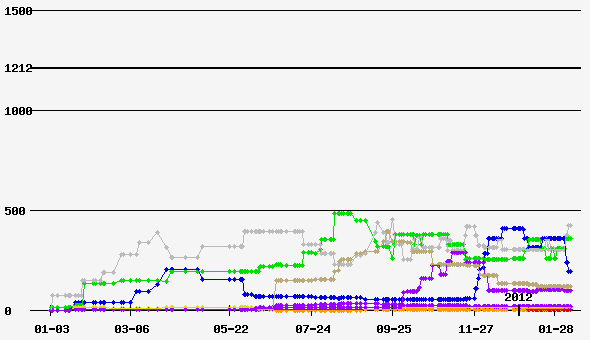
Back to 2012 Presidential Polls Home - Polls Home


Terms of Use - DCMA Policy - Privacy Policy and Cookies

© Dave Leip's Atlas of U.S. Elections, LLC 2019 All Rights Reserved