


|
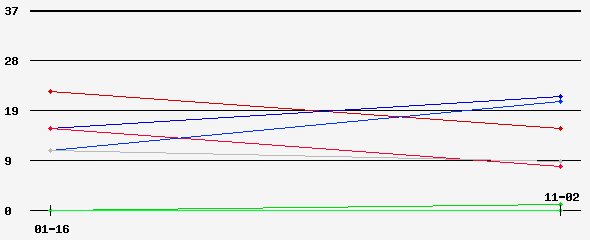
Date of Prediction: 2010-11-02 Version:2
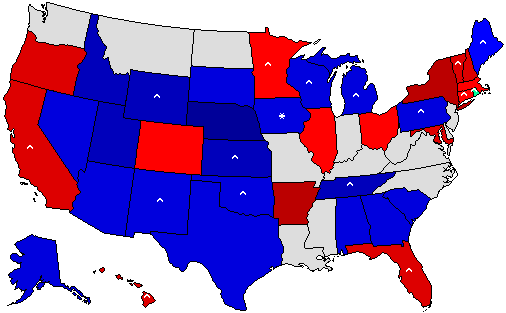
Prediction Map
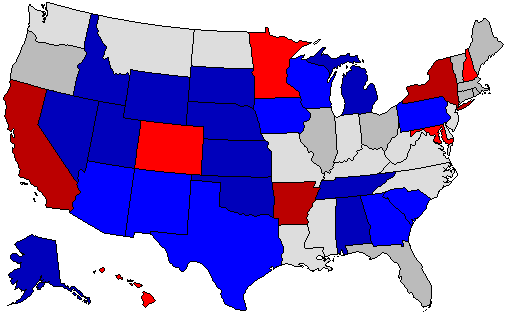
* = Pickup via defeat of incumbent; ^ = Pickup of an open seat Confidence Map
Prediction States Won
Confidence States Won
State Pick-ups
Prediction Score (max Score = 74)
Analysis
I don't see too many surprises happening. Illinois is probably the closest to that. I think Ohio is a total coin toss. If I'm wrong about any, it'll probably be those two. Other than those, I'm least confident in predicting Connecticut and Rhode Island right now. I feel more confident in choosing the remaining tossups, although they obviously could quite easily go any way in the end.
Prediction History
Comments History
- hide
Version: 1 I don't expect many surprises here, as I think there will be more of an anti-incumbent tide in governor's races. I think Democrats have a stronger candidate in Florida and I think Rick Perry goes down in Texas in the general election. All in all, this prediction has 15 switches, which could conceivably be even higher.
Version History Member Comments User's Predictions
Links
|
|||||||||||||||||||||||||||||||||||||||||||||||||||||||||||||||||||||||||||||||||||||||||||||||||||||||||||||||||||||||||||||||||||||||||||||||||||||||||||||||||||||||||||||||||||||||||||||||||||||||||||||||||||||||||||||||||||||||||||||||||||||||||||||||||||||||||||||||||||||||||||||||||||||||||||||||||||||||||||||||||||||||||||||||||||||||||||||||||||||||||||||||||||||||||||||
 2022 Senate
 2022 Governor
 2020 President
 2020 Senate
 2020 Governor
 2016 President
 2016 Senate
 2016 Governor
 2014 Governor
 2013 Governor
 2012 President
 2012 Senate
 2012 Governor
 2010 Senate
 2010 Governor
 2008 President
 2008 Senate
 2008 Governor
 2007 Governor
 2006 U.S. Senate
 2006 Governor


Back to 2010 Gubernatorial Prediction Home - Predictions Home