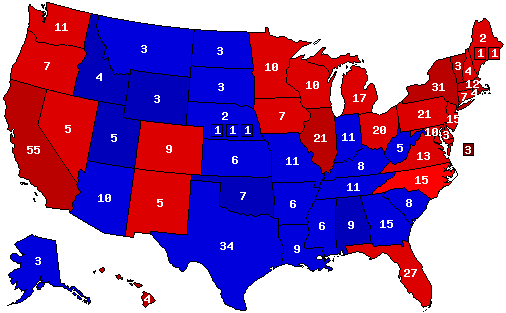
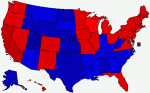
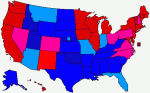
PredictionsMock2008 Presidential Predictions - FrenchEd (D-NJ) ResultsPolls
Note: The Google advertisement links below may advocate political positions that this site does not endorse.
Date of Prediction: 2008-11-03 Version:64

Prediction Map
FrenchEd MapPrediction Key

Confidence Map
FrenchEd MapConfidence Key

Prediction States Won
270 |
538 |
pie
Dem353
 
Rep185
 
Ind0


Confidence States Won
270 |
538 |
pie
Dem291
 
Rep157
 
Ind0
 
Tos90
 

State Pick-ups

Gain Loss Hold Net Gain
ST CD EV ST CD EV ST CD EV
Dem+80+101000202252+101
Rep000-80-101233185-101
Ind0000000000


Prediction Score (max Score = 112)

ScoreState WinsState PercentagesCD WinsCD Percentages
101504443
piepiepiepiepie

Analysis

FINAL PREDICTION:

Sen. Barack Obama (D-IL)
Sen. Joseph Biden (D-DE)
projected to win 52.5% of the popular vote and 353 electoral votes.

Sen. John McCain (R-AZ)
Gov. Sarah Palin (R-AK)
projected to win 46% of the popular vote and 185 electoral votes.

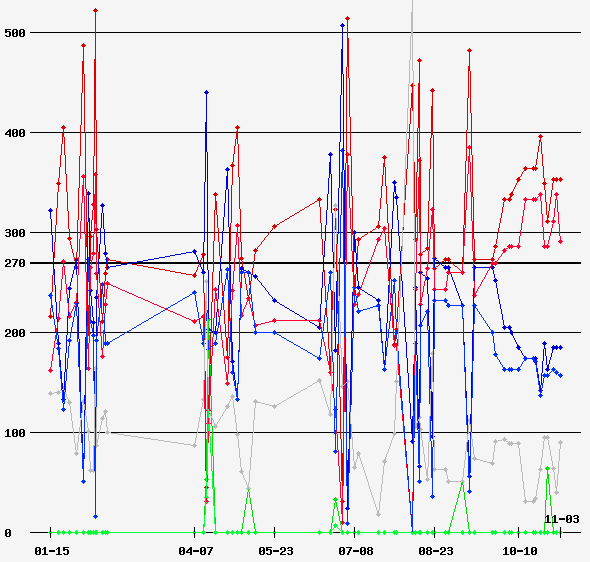
Margin of error: 90% confidence on a 50.5-54.5 to 44-48 Obama victory with 291 to 396 electoral votes, i.e. 2-point margin of error on the popular vote and 62 electoral votes on the electoral count.

AL: M 62, O 37
AK: M 57, O 38
AZ: M 53, 0 46
AR: M 55, O 44
CA: O 61, M 38
CO: O 52, M 47
CT: O 58, M 40
DE: O 58, M 40
FL: O 51, M 48
GA: M 52, O 46
HI: O 65, M 33
ID: M 63, O 35
IL: O 61, M 38
IN: M 50, O 49
IA: O 55, M 44
KS: M 56, O 43
KY: M 56, O 43
LA: M 57, O 42
ME: O 57, M 41
MD: O 58, M 40
MA: O 61, M 38
MI: O 56, M 43
MN: O 55, M 44
MS: M 54, O 45
MO: M 50, O 49
MT: M 50, O 46
NE: M 58, 0 40
NV: O 52, M 47
NH: O 54, M 45
NJ: O 58, M 41
NM: O 55, M 44
NY: O 62, M 37
NC: O 50, M 49
ND: M 51, O 48
OH: O 52, M 47
OK: M 63, O 37
OR: O 56, M 42
PA: O 53, M 46
RI: O 61, M 37
SC: M 56, O 43
SD: M 54, O 45
TN: M 56, O 43
TX: M 55, O 44
UT: M 65, O 33
VT: O 61, M 36
VA: O 52, M 47
WA: O 57, M 41
WV: M 55, O 44
WI: O 55, M 44
WY: M 61, O 38
DC: O 90, M 8

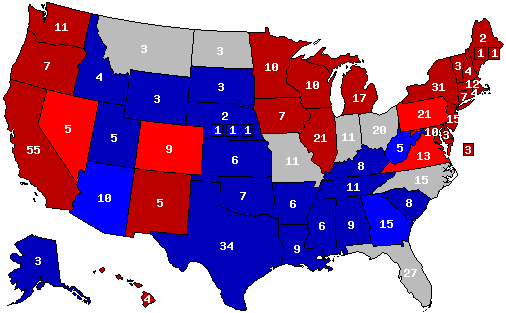
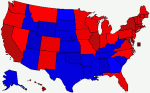
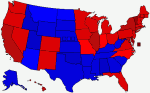
Toss-up means the state can essentially go both ways.
Lean means the chance are at least 5 to 1 the state will go for the candidate, but no more than 20 to 1.
Strong means the state goes for the candidate unless an unforeseen event or landslide occurs on one side or the other.


Prediction History
Prediction Graph


Comments History - show

Version History


Member Comments
 By: FrenchEd (D-NJ) 2008-11-06 @ 17:40:33
Missed:
-1 call, IN.
-5 percentages, AK, DE, HI, MD, MO.
NE-03 and ME-01 results unknown. NE-02 too close to call.

101 to 105 out of 112 right.
90.2 to 93.8 right.

Not bad, I'd say.

As far as specific percentages are concerned, here are the state where I missed one candidate's percentage by more than 2 points (meaning a margin missed by more than 4):
AK, DE, DC, MD, MS, NV, ND, VT and WY.

Got exactly right: MO, NH, NY, NC, TX.

So... Pretty good results, I'd say. The credit goes 80% to polls, 15% to my guts, and maybe 5% to my brains. :-)

Last Edit: 2008-11-07 @ 09:35:16
prediction Map

 By: FiveSenses99 (--MO) 2008-11-06 @ 18:45:16
Yes French, let this be a lesson to those who try to claim the polls aren't right, and that they can magically know how the electorate is going to vote, because the "real americans" are on their side.

The polls are almost always correct.
prediction Map

 By: wingindy (I-IN) 2008-11-07 @ 01:30:20
Pretty good, French, but you missed the call on IN, not MO. You missed CT%, too, at 60.2%. How'd you miss DE & MD??? prediction Map

 By: FrenchEd (D-NJ) 2008-11-07 @ 09:50:39
I don't know. I just didn't figure out the Obama wave correctly in the North East, and generally underestimated his vote. I thought the really heavy Dem vote was concentrated in NY and New England.

Thanks for the typo, I was just slightly tired. :-)

I didn't exactly now about CT when I posted, I only knew it'd be around 60%. Apparently I missed it, since I don't think the 1.8% will change that result. No place in CT is Republican enough. :-)
And I also missed MT, where the popular vote is finally just under 50% for McCain.

I was really impressed by the Obama surge. Especially happy about Virginia, Indiana and North Carolina. And also the gigantic swing in Nevada. You know, the state than leaned McCain throughout and saw the light in mid-october?

Things I'm disappointed about:
-the Senate race in Alaska. Stevens' reelection is an utter scandal. These people are completely stupid and immoral. So much for the holier than thou GOP. Their new motto will be "proud to be corrupt".
-in Minnesota, though I don't really care about the Senate race, Michele Bachmann's reelection is also incomprehensible.
-in California, the so-called open and progressive state, the failure of Prop 8 is a shame. Such intolerance, among Democrats and Republicans alike, is just beyond words.

So I'm now at 99 to 103 correct, which means from 88.4 to 92%.
prediction Map

 By: wingindy (I-IN) 2008-11-07 @ 14:45:39
The gigantic-ist swing (from '04) was Indiana. Look at NYT trend map and behold the block of deep blue that is Indiana. LOL.

The toughest calls on percentages, IMHO: MA, CT at 60%+, & DC at 90%+ !?!?!. These exceeded polling and pre-election projections. Very few got all three correct.
Anyone calling HI at 70% and CA at 60%+ should be pretty happy also.

I take it Liep will wait until certification of results - early Dec.(?) to post scores. Anyone know?
prediction Map

 By: FrenchEd (D-NJ) 2008-11-07 @ 16:25:19
California, Massachusetts could be anticipated with polls (which I did).
Connecticut was tougher.
Hawaii -it would have been a wild extrapolation and a terrific insight.

For DC, my reasoning was simple:
1) John Kerry performed very well in DC, winning 89% of the vote. That could mean the Democratic vote is now going to recede somewhat, but it could also mean DC is trending Dem (as far as it can without crossing the 100% line...).
2) Barack Obama will perform better nationally than Kerry. The only reason where that was seriously in doubt was the western part of the South (KY, TN, AR, LA, OK). There was no reason DC would escape the trend.
3) DC is heavily AA-populated. Meaning huge turnouts for Obama.

If I had anticipated a white, losing by 3 candidate like Kerry, my projection would have been slightly lower, probably 86 - 12. However, both the black vote and the national trend made me lean toward a figure slightly above 90%. But the 93% figure is simply huge.


prediction Map

 By: FrenchEd (D-NJ) 2008-12-13 @ 19:12:27
Hey I've just noticed something: there are a heck of a lot of state with two Dem senators and a Dem governor:
New York
Illinois, that is depending on how many special elections they run for senator and governor :-( IMPEACH BLAGOJEVICH NOW!
Michigan
New Jersey
Virginia
Massachusetts
Washington
Wisconsin
Maryland
Colorado
Oregon
Arkansas
West Virginia
New Mexico
Rhode Island
Delaware
Montana
for a grand total of... 17 states! Hope is on the way, people...
Of course, this is taking into account the 111th incoming Congress.

And here is a theorem: where you have two Democratic Senators, the governor is Democratic, except in California, Hawaii, North Dakota, and maybe Minnesota if Franken pulls this thing by 1.27 votes. And unless, of course, you count socialists and traitors. I mean, Connecticuters for Lieberman.

Now look at the Republicans...

14 states have two Republican senators (for those have trouble with math, there are 20 such Democratic states, 22 if you consider the caucus).

And what's more, the theorem doesn't work quite as well with the GOP:
-Some do have a GOP gov: that would be Texas, Utah, Idaho, Alabama, Mississippi, Georgia and South Carolina (7, the big Republican Bushian Texas, two of the hyper-GOP trifecta out west and four of the very Deep South).
-7 are exceptions, which is kind of odd because they're as numerous: Wyoming, Oklahoma, Kansas, Kentucky, Tennessee, Maine and Arizona (actually, Arizona should be moved in the upper category if the 2009-11 period is to be considered, since Janet Napolitano's successor will be a Republican woman).
prediction Map

 By: bonncaruso (D-DEU) 2008-12-17 @ 03:56:52
It looks like, when all is said and done and the very last straggler write-in votes will be made official in the next 30-60 days, that Obama's national winning margin will be +7.24.

Of this, I am 99.999% sure, but not 100%. But it looks like it.

With that in mind, that makes the national swing from 2004 to 2008: +9.70.

With these numbers now set in stone, I am just about to produce the end-statistics in a massive way. Stay tuned.
prediction Map

 By: FrenchEd (D-NJ) 2008-12-22 @ 17:19:13
101/112 is about 89-90%. Not bad.

Actually, a 2004 map would have got a 70/112 mark, or 62-63% score.
42 points lost:
20 lost in NV, CO, NM, IA, OH, IN, VA, NC, FL and NE-02, which swung (2 each).
22 lost in HI, AK, CA, MT, UT, ND, NE, NE-01, NE-03, KS, TX, WI, IL, MO, MD, DE, DC, VT, RI, CT, NY and ME-01.
Please notice that all the swinging was from Bush to Obama in terms of states (all >50 Bush except NM, IA (>40) and NE-02 (>60) to >50 Obama except NC, IN and NE-02 (>40)) and an increase in Dem percentage in Obama states or a decrease in GOP percentage in McCain states in terms of percentages (that increase/decrease was always 10% except in Hawaii, where it was 20%).
prediction Map

 By: dnul222 (D-MN) 2008-12-24 @ 07:01:16
I did call Hawaii at 70 per cent...but not CA at 60 percent...on to 2010!prediction Map

 By: FrenchEd (D-NJ) 2009-02-11 @ 05:10:24
What if scenario for NO ELECTORAL MAJORITY:

A change of 494,349 votes (0.38% of the national total) from Barack Obama to John McCain results in an electoral tie:

NE-02: 631 votes
NC: 7,089 votes
IN: 14,196 votes
CO: 107,494 votes
VA: 117,264 votes
FL: 118,226 votes
OH: 129,449 votes

The election would have been decided by the House of Representatives.
prediction Map

 By: FrenchEd (D-NJ) 2009-02-11 @ 05:28:59
What if scenario for MCCAIN WINS:

A change of 528,496 votes (0.40% of the national total) from Barack Obama to John McCain results in a victory for John McCain:

All states above: 494,349 votes
NH: 34,147 votes

McCain:
60,463,310 votes
46.02% of the popular vote
273 electoral college votes

Obama:
68,928,402
52.47% of the popular vote
269 electoral college votes

John McCain is elected President of the United States.

I challenge anyone to find a McCain victory with a lesser swing of votes. :-)
prediction Map


User's Predictions

Prediction Score States Percent Total Accuracy Ver #D Rank#Pred
P 2012 President 55/56 45/56 100/112 89.3% pie 12 1 115T760
P 2012 Senate 31/33 23/33 54/66 81.8% pie 2 1 40T343
P 2012 Governor 10/11 7/11 17/22 77.3% pie 2 1 51T228
P 2012 Rep Primary 44/52 9/52 53/104 51.0% pie 10 - 64T231
P 2010 Senate 34/37 28/37 62/74 83.8% pie 24 4 21T456
P 2010 Governor 35/37 26/37 61/74 82.4% pie 6 1 29T312
P 2009 Governor 2/2 2/2 4/4 100.0% pie 4 6 1T103
P 2008 President 54/56 47/56 101/112 90.2% pie 64 1 6T1,505
P 2008 Senate 32/33 23/33 55/66 83.3% pie 19 4 28T407
P 2008 Governor 11/11 7/11 18/22 81.8% pie 4 2 50T264
P 2008 Dem Primary 37/52 21/52 58/104 55.8% pie 16 - 52T271
P 2008 Rep Primary 35/49 15/49 50/98 51.0% pie 15 - 52T235
Aggregate Predictions 380/429 253/429 633/858 73.8% pie


Back to 2008 Presidential Prediction Home - Predictions Home


Terms of Use - DCMA Policy - Privacy Policy and Cookies

© Dave Leip's Atlas of U.S. Elections, LLC 2019 All Rights Reserved