Analysis
I've said for well over a year that Romney was the weakest possible nominee for the GOP and I am grateful to have been proved right. He's trailing a president with 8.something% unemployment, trillion dollar deficits as far as the eye can see, $4+ gasoline, and embassies under attack around the world? Seriously? NO, SERIOUSLY?
OK, so I took a bunch of states away from my original, 11-03-2011 prediction, but I "kept them in spirit" by making them "tossups" -- meaning they are states that any real conservative alternative to Obama would've won.
On a personal note, if I were forced to choose between Romney and Obama, I'd vote for Obama. (Better to have a jerk who CAN'T get his idiot agenda passed than one who can.) However, I'm glad I'll be able to vote for Gary Johnson, and I HOPE that my ONE VOTE will be the one that decides Florida and steals the race from Romney.
P.S. I wanted to get this, my final prediction in before the debates, since I've been one who's said the debates won't matter.
Comments History
-
hideVersion: 8
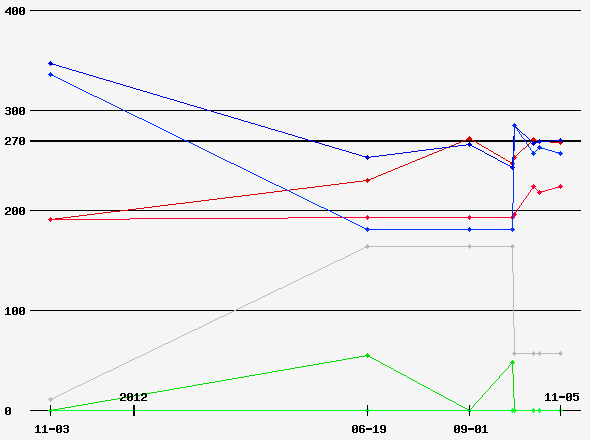
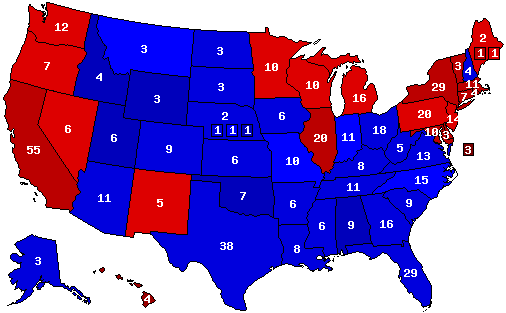
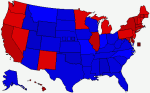
Election Eve map based on Rasmussen polls only.
Ohio and Wisconsin are tied in the Rasmussen polls. Romney needs either one to win.
Version: 7
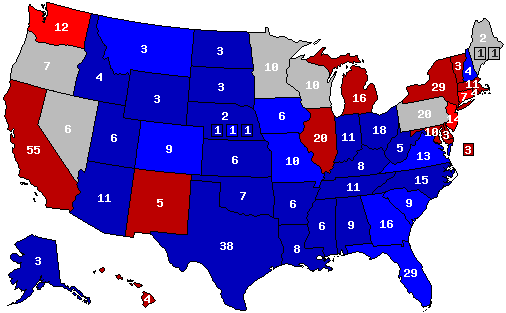
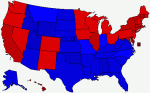
This seems to me to be the EASIEST way to a 269-269 tie.
Version: 6
This map is based on a new story that says that Obama's NEW "blue firewall" (red on this map) is NV-IA-OH-NH.
http://www.nationalreview.com/campaign-spot/330793/obamas-new-firewall-ohio-iowa-new-hampshire-and-nevada
Though I'm the ONLY commentator that I know of who noticed, 2008 was the first time in 100 YEARS that all of the States-That-Won-The-Civil-War (or "Civil War North") voted for the same candidate. In 1908, they all voted for Taft against Bryant. Not until 2008 would they all vote the same way again -- but this time FOR the Democrat. (It's still fascinating for me to hear Democrats claim that their party stands for the same things now as it did back then -- and that "the party didn't change, the people did!")
Anyway, in this map we can see that Obama loses in the Civil War North only perennially difficult IN and the home state of the GOP Veep candidate, WI. OTOH, as I've said since day one, Obama's not counting on getting a single vote between the Potomac and Rio Grande.
Version: 5
I've said for well over a year that Romney was the weakest possible nominee for the GOP and I am grateful to have been proved right. He's trailing a president with 8.something% unemployment, trillion dollar deficits as far as the eye can see, $4+ gasoline, and embassies under attack around the world? Seriously? NO, SERIOUSLY?
OK, so I took a bunch of states away from my original, 11-03-2011 prediction, but I "kept them in spirit" by making them "tossups" -- meaning they are states that any real conservative alternative to Obama would've won.
On a personal note, if I were forced to choose between Romney and Obama, I'd vote for Obama. (Better to have a jerk who CAN'T get his idiot agenda passed than one who can.) However, I'm glad I'll be able to vote for Gary Johnson, and I HOPE that my ONE VOTE will be the one that decides Florida and steals the race from Romney.
P.S. I wanted to get this, my final prediction in before the debates, since I've been one who's said the debates won't matter.
Version: 4
Again, this is not a prediction map, but a projection map. I took the latest polls, and gave them some minor tweaks and came up with this "FLORIDA WINS IT ALL" map.
Here we have Romney at 243, Obama at 247 and only THREE states "too close to call". And of the three, only FLORIDA matters. A candidate can win NV and VA and still lose to whoever wins FL.
Regarding my tweaks: I notice that some of the MSM -- notably CNN -- is starting to ask questions about Libya. That's gonna hurt Obama. So will the fact that Univision is running devastating Spanish-language reports on "Fast and Furious". That tips CO into the Romney camp and makes NV a tossup. It's hard to believe that any Republican nowadays has a chance in "Roundhead Country" (New England), but Romney's been spending an inordinate amount of time in NH, so his polling must be showing something there.
Version: 3
In the forum a couple of months ago, before my Tea Party views were banned, I showed this map and said this was my "best case scenario" for Obama: Romney would win back just FIVE Bush states that McCain lost -- FL, NC, VA, OH, and IN -- and the race would come down to Iowa.
This map shows my thinking that the growing Hispanic vote and Gary Johnson's Libertarian vote might suffice to hold NM, CO, and NV for Obama.
The map also reflects that I made it before Paul Ryan was tapped for the GOP VP slot. I kept saying in the forum "polls" that I thought Ryan would be Romney's optimal pick, just for the fact that he could help in the Upper Midwest states.
We all know that the BEST POLLS of the race are the ones being done by the campaigns, not Gallup, Rasmussen, or any of the "public" polling firms. And I notice that recently Obama is "camping out" in Iowa, so I'm wondering if his mapmakers are thinking the same things that this map reflects.
NOTE: My "official prediction" map is still the one I made Nov. 3, 2011 (before I knew even who the GOP nominee would be).
Version: 2
This map is based on the polls as reported here. All I did was to give 2/3s of the "undecideds" to Romney and 1/3 to Obama.
That leaves it a very tight race with only five true "toss-up" states: CO, IA, WI, MI, and VA.
But as I've said before, I don't believe in polls taken before Labor Day, so this isn't my prediction map, it's just a "projection" map of the current (June 19, 2012) USEA average of polls.


 2012 President


