


|
Date of Prediction: 2016-06-26 Version:206
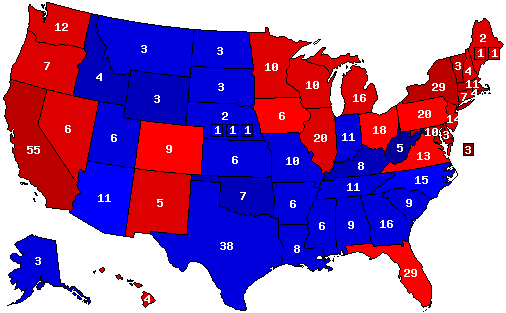
Prediction Map
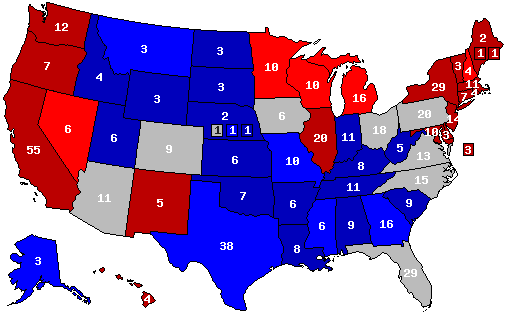
Confidence Map
Prediction States Won
Confidence States Won
State Pick-ups
Analysis
Could this be the very 1st presidential election ever to have the same identical Electoral College map as the prior election? Could very well happen in 2016 believe it or not. NC, CO and AZ could very well determine that, even in a Hillary-Donald matchup. I now think there won't be as many changes to the Electoral College map at all except in a landslide, especially with polls now showing Donald ahead of Hillary in NC. That's how inelastic the Electoral Map is right now, even in a sharply divided 50/50 country which you wouldn't think would be the case at all. I thought NC definitely would shift but the last PPP poll had Trump winning there by a slim margin. It will also be interesting to see if the recent poll showing Hillary ahead of Trump in double digits is legit. I don't think it is. But if it indeed is states like AZ could shift, and definitely NC. Perhaps IN, MO, GA, the Omaha NE district, maybe even a few others. Even then most states still seem to be rock solid right now even at that. Wait and see as always.
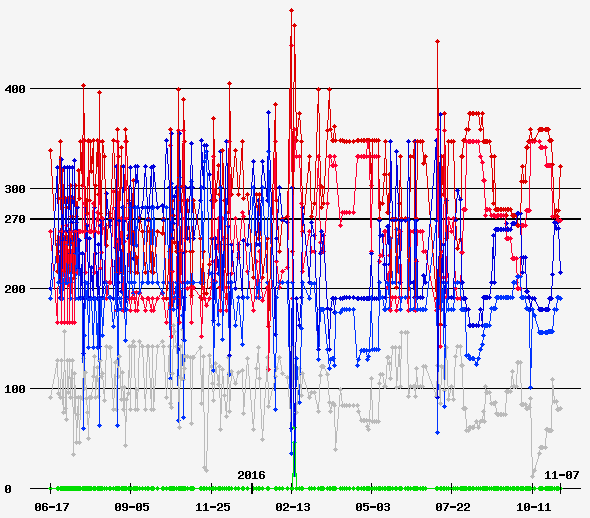
Prediction History
Comments History
- show
Version History Member Comments User's Predictions
Links
|
|||||||||||||||||||||||||||||||||||||||||||||||||||||||||||||||||||||||||||||||||||||||||||||||||||||||||||||||||||||||||||||||||||||||||||||||||||||||||||||||||||||||||||||||||||||||||||||||||||||||||||||||||||||||||||||||||||||||||||||||||||||||||||||||||||||||||||||||||||||||||||||||||||||||||||||||||||||||||||||||

 2022 Senate
 2022 Governor
 2021 Governor
 2020 President
 2020 Senate
 2020 Governor
 2019 Governor
 2018 Senate
 2018 Governor
 2016 President
 2014 Senate
 2012 President
 2011 Governor
 2010 Senate
 2008 President
 2008 Senate
 2008 Governor
 2007 Governor


Back to 2016 Presidential Prediction Home - Predictions Home