


Note: The Google advertisement links below may advocate political positions that this site does not endorse.
|
Date of Prediction: 2015-07-06 Version:13
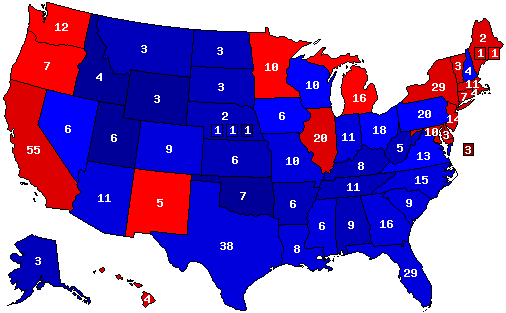
Prediction Map
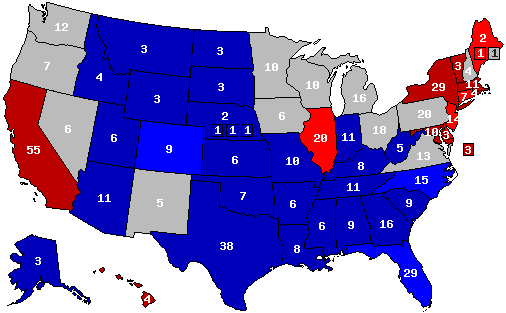
Confidence Map
Prediction States Won
Confidence States Won
State Pick-ups
Analysis
Hillary vs. generic Republican as of July 6, 2015 "shockingly blowout loss" map. Once again all this depends upon Obama's approval ratings which I do feel are being overly inflated right now, and exactly how much the Confederate flag and gay marriage issues resonate in the red (blue on this site) states the South especially. NC and FL are gone and probably even VA too. Outside the South the Obama approval rating is most important in this particular scenario, and I don't think he's as popular outside the South either as much as most people think, and this will hurt Hillary big time too if I'm right, and I hope and pray I'm wrong this time.
Prediction History
Comments History
- show
Version History Member Comments User's Predictions
Links
|
|||||||||||||||||||||||||||||||||||||||||||||||||||||||||||||||||||||||||||||||||||||||||||||||||||||||||||||||||||||||||||||||||||||||||||||||||||||||||||||||||||||||||||||||||||||||||||||||||||||||||||||||||||||||||||||||||||||||||||||||||||||||||||||||||||||||||||||||||||||||||||||||||||||||||||||||||||||||||||||||

 2022 Senate
 2022 Governor
 2021 Governor
 2020 President
 2020 Senate
 2020 Governor
 2019 Governor
 2018 Senate
 2018 Governor
 2016 President
 2014 Senate
 2012 President
 2011 Governor
 2010 Senate
 2008 President
 2008 Senate
 2008 Governor
 2007 Governor


Back to 2016 Presidential Prediction Home - Predictions Home
© Dave Leip's Atlas of U.S. Elections, LLC 2019 All Rights Reserved