


|
Date of Prediction: 2015-11-23 Version:18
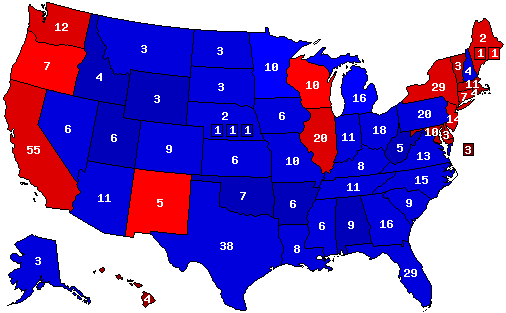
Prediction Map
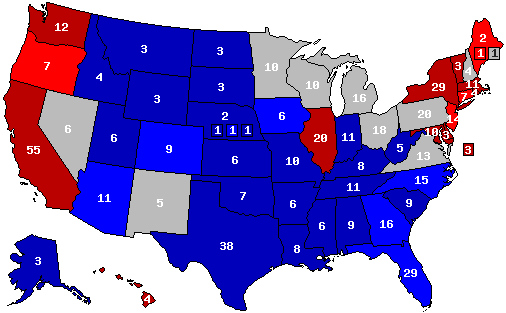
Confidence Map
Prediction States Won
Confidence States Won
State Pick-ups
Analysis
No Analysis Entered
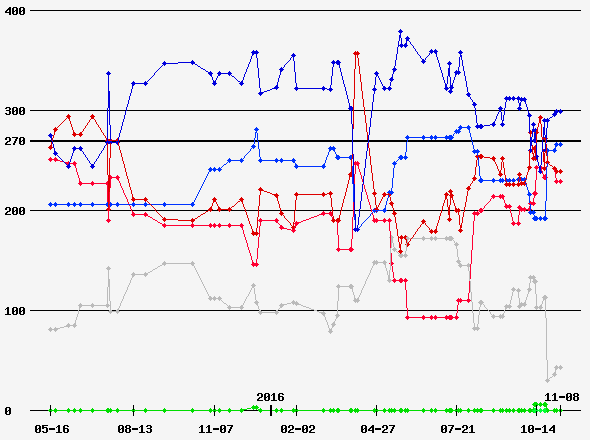
Prediction History
Comments History
- hide
Version: 67 THANK YOU MAINE LUMBERJACKS Version: 64 Wisconsin and Michigan are the states I'm least confident that Trump will carry. Version: 48 Moved Ohio from lean to strong R. Version: 43 The Democratic Party has been blighted with the least competent major presidential candidate since George McGovern. Version: 37 Donald J. Trump will assemble a left-centre-right coalition that will carry him to a landslide victory in November. MAKE AMERICA GREAT AGAIN! Version: 36 Donald J. Trump will sew up the Republican nomination after California, and go on to win the presidency in November. MAKE AMERICA GREAT AGAIN! Version: 35 Cruz/Ryan/Kasich vs. Clinton. Version: 34 An optimistic projection for the GOP in a Ryan (or Cruz) vs. Clinton race. Version: 32 March has been a terrible month for Trump. Version: 29 Post Chicago. Version: 27 Moved Minnesota to lean Democratic. Version: 26 Trump vs. Clinton post-Iowa. Version: 25 January 30th 2016: Trump (53.8%) vs. Clinton (44.4%). The result of playing around with FiveThirtyEight's Swing-O-Matic tool. Version: 23 Trump vs. Clinton, January 2016. Version: 22 Trump vs. Clinton, Christmas 2015. Version: 20 Trump vs. Clinton vs. Sanders in light of the recent drama between the DNC and the Sanders campaign. Version: 16 Trump v. Clinton one year out. Version: 15 Trump vs. Clinton as of 11-03-15. Version: 14 Trump vs. Clinton as of mid-October 2015. Version: 11 This map assumes Trump and Clinton to be the nominees of their respective parties. Version: 8 This map assumes Trump to be the nominee. Version: 6 Clinton polls unusually poorly in Ohio. I would bet on a Republican victory here if Kasich or Paul were to win the nomination. Version: 4 Recent polling indicates Clinton is a poor fit for Ohio. Version: 2 A narrower margin of victory for the Democratic party's third term. Think 1988.
Version History Member Comments User's Predictions
User Info
Links
|
||||||||||||||||||||||||||||||||||||||||||||||||||||||||||||||||||||||||||||||||||||||||||||||||||||||||||||||||||||||||||||||||||||||||||||||||||||||||||||||||||||||||||||||||||

 2024 President
 2020 President
 2018 Senate
 2016 President
 2016 Senate


Back to 2016 Presidential Prediction Home - Predictions Home