| Map | Pie | Office | Total | D | R | I | Margin | %Margin | Dem | Rep | Ind | Oth. | Dem | Rep | Ind | Other | | | | | | | | | | | | | | | | | | |
|---|
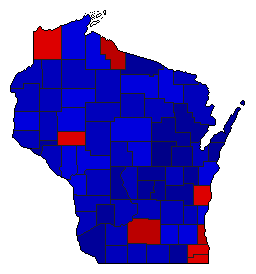
 | 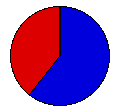 | President |
1,607,370 |
2 |
1 |
- |
357,569 |
22.25% |
38.71% |
60.95% |
0.00% |
0.34% |
622,175 |
979,744 |
0 |
5,451 |
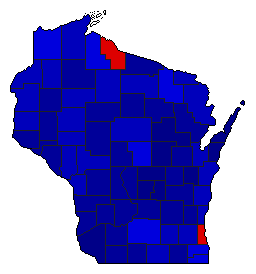
 | | Senator |
1,605,167 |
2 |
1 |
3 |
139,042 |
8.66% |
45.57% |
54.23% |
0.12% |
0.09% |
731,402 |
870,444 |
1,879 |
1,442 |
 | | Governor |
1,615,214 |
2 |
1 |
3 |
407,327 |
25.22% |
37.26% |
62.48% |
0.23% |
0.03% |
601,844 |
1,009,171 |
3,706 |
493 |
 |  | Lt. Governor |
1,563,405 |
2 |
1 |
3 |
430,292 |
27.52% |
36.12% |
63.64% |
0.23% |
0.00% |
564,725 |
995,017 |
3,652 |
11 |
 |  | Secretary of State |
1,573,395 |
2 |
1 |
0 |
505,300 |
32.12% |
33.94% |
66.06% |
0.00% |
0.00% |
534,017 |
1,039,317 |
0 |
61 |
 |  | State Treasurer |
1,553,771 |
2 |
1 |
0 |
429,350 |
27.63% |
36.18% |
63.81% |
0.00% |
0.00% |
562,188 |
991,538 |
0 |
45 |
 |  | Attorney General |
1,538,714 |
2 |
1 |
0 |
431,275 |
28.03% |
35.98% |
64.01% |
0.00% |
0.00% |
553,685 |
984,960 |
0 |
69 |
|
