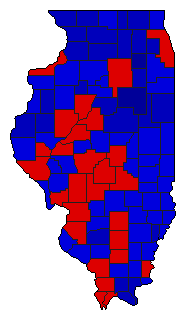
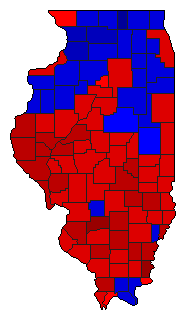
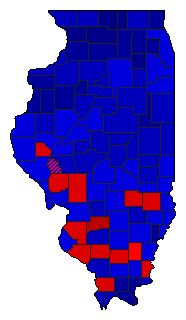
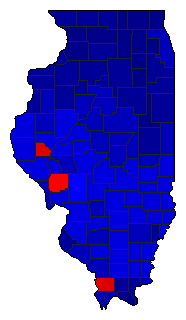
| Map | Pie | Year | Total | D | R | I | Margin | %Margin | Dem | Rep | Ind | Oth. | Dem | Rep | Ind | Other | | | | | | | | | | | | | | | | | | |
|---|
 |  | 1968 |
4,344,669 |
1 |
2 |
0 |
108,725 |
2.50% |
50.99% |
48.49% |
0.00% |
0.52% |
2,215,401 |
2,106,676 |
0 |
22,592 |
 |  | 1932 |
3,180,495 |
1 |
2 |
3 |
298,356 |
9.38% |
53.83% |
44.45% |
1.22% |
0.50% |
1,711,969 |
1,413,613 |
38,865 |
16,048 |
 |  | 1928 |
2,878,441 |
2 |
1 |
3 |
553,912 |
19.24% |
40.13% |
59.37% |
0.44% |
0.06% |
1,155,093 |
1,709,005 |
12,709 |
1,634 |
 |  | 1924 |
2,220,944 |
2 |
1 |
3 |
823,255 |
37.07% |
31.00% |
68.07% |
0.76% |
0.17% |
688,603 |
1,511,858 |
16,816 |
3,667 |
 |  | 1920 |
2,075,109 |
2 |
1 |
3 |
832,849 |
40.14% |
26.80% |
66.94% |
3.17% |
3.09% |
556,131 |
1,388,980 |
65,819 |
64,179 |
|