| Map | Pie | Office | Total | D | R | I | Margin | %Margin | Dem | Rep | Ind | Oth. | Dem | Rep | Ind | Other | | | | | | | | | | | | | | | | | | |
|---|
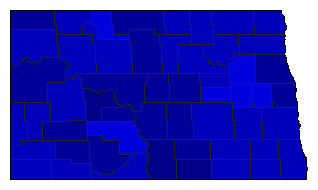
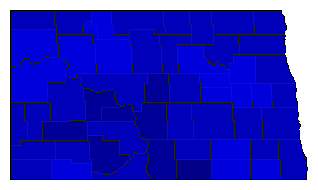 | | Governor |
193,501 |
2 |
1 |
0 |
55,005 |
28.43% |
35.79% |
64.21% |
0.00% |
0.00% |
69,248 |
124,253 |
0 |
0 |
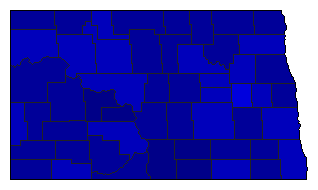
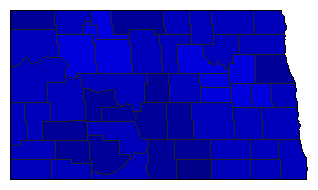 |  | Lt. Governor |
185,047 |
2 |
1 |
0 |
59,305 |
32.05% |
33.98% |
66.02% |
0.00% |
0.00% |
62,871 |
122,176 |
0 |
0 |
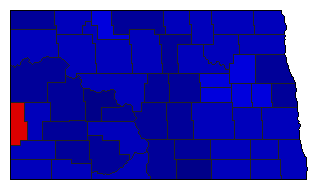
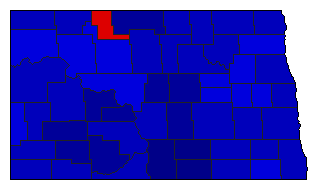 |  | Secretary of State |
178,310 |
2 |
1 |
0 |
54,192 |
30.39% |
34.80% |
65.20% |
0.00% |
0.00% |
62,059 |
116,251 |
0 |
0 |
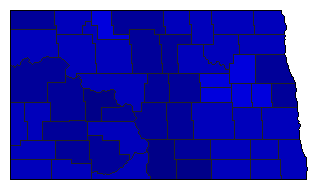
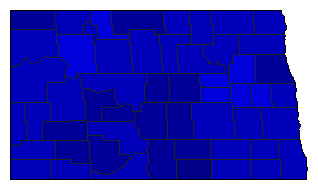 |  | State Treasurer |
183,083 |
2 |
1 |
0 |
60,533 |
33.06% |
33.47% |
66.53% |
0.00% |
0.00% |
61,275 |
121,808 |
0 |
0 |
 |  | Attorney General |
179,210 |
2 |
1 |
0 |
62,802 |
35.04% |
32.48% |
67.52% |
0.00% |
0.00% |
58,204 |
121,006 |
0 |
0 |
 |  | State Auditor |
190,940 |
2 |
1 |
0 |
79,766 |
41.78% |
29.11% |
70.89% |
0.00% |
0.00% |
55,587 |
135,353 |
0 |
0 |
 |  | Insurance Commissioner |
180,071 |
2 |
1 |
0 |
61,487 |
34.15% |
32.93% |
67.07% |
0.00% |
0.00% |
59,292 |
120,779 |
0 |
0 |
 |  | Agriculture Commissioner |
186,731 |
2 |
1 |
0 |
65,365 |
35.00% |
32.50% |
67.50% |
0.00% |
0.00% |
60,683 |
126,048 |
0 |
0 |
|
