| Map | Pie | Office | Total | D | R | I | Margin | %Margin | Dem | Rep | Ind | Oth. | Dem | Rep | Ind | Other | | | | | | | | | | | | | | | | | | |
|---|
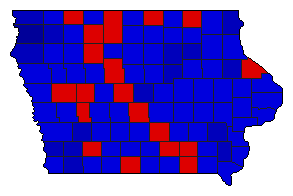
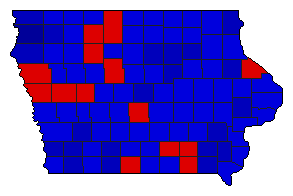
 |  | President |
1,234,564 |
2 |
1 |
0 |
227,329 |
18.41% |
40.65% |
59.06% |
0.00% |
0.29% |
501,858 |
729,187 |
0 |
3,519 |
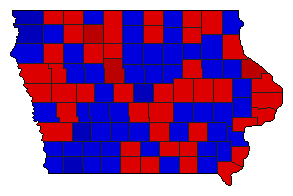
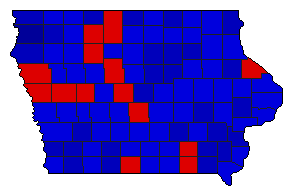
 |  | Senator |
1,178,655 |
2 |
1 |
0 |
92,343 |
7.83% |
46.08% |
53.92% |
0.00% |
0.00% |
543,156 |
635,499 |
0 |
0 |
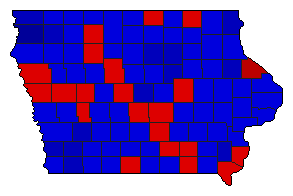
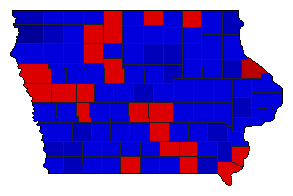
 |  | Governor |
1,204,235 |
1 |
2 |
0 |
29,469 |
2.45% |
51.22% |
48.78% |
0.00% |
0.00% |
616,852 |
587,383 |
0 |
0 |
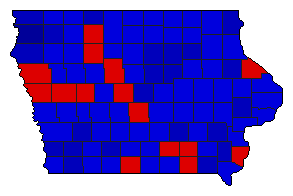
 |  | Lt. Governor |
1,158,220 |
2 |
1 |
0 |
48,668 |
4.20% |
47.90% |
52.10% |
0.00% |
0.00% |
554,776 |
603,444 |
0 |
0 |
 |  | Secretary of State |
1,150,620 |
2 |
1 |
0 |
102,368 |
8.90% |
45.55% |
54.45% |
0.00% |
0.00% |
524,126 |
626,494 |
0 |
0 |
 |  | State Treasurer |
1,147,005 |
2 |
1 |
0 |
96,705 |
8.43% |
45.78% |
54.22% |
0.00% |
0.00% |
525,150 |
621,855 |
0 |
0 |
 |  | Attorney General |
1,140,423 |
2 |
1 |
0 |
69,917 |
6.13% |
46.93% |
53.07% |
0.00% |
0.00% |
535,253 |
605,170 |
0 |
0 |
 |  | State Auditor |
1,145,102 |
2 |
1 |
0 |
113,194 |
9.89% |
45.06% |
54.94% |
0.00% |
0.00% |
515,954 |
629,148 |
0 |
0 |
 |  | Agriculture Commissioner |
1,149,889 |
2 |
1 |
0 |
92,495 |
8.04% |
45.98% |
54.02% |
0.00% |
0.00% |
528,697 |
621,192 |
0 |
0 |
|
