| Map | Pie | Office | Total | D | R | I | Margin | %Margin | Dem | Rep | Ind | Oth. | Dem | Rep | Ind | Other | | | | | | | | | | | | | | | | | | |
|---|
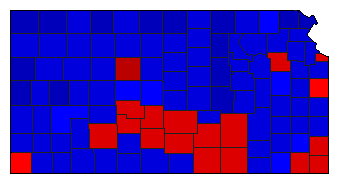
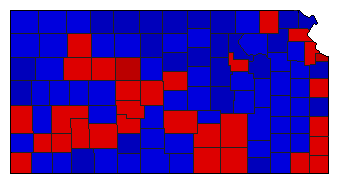
 |  | President |
857,901 |
1 |
2 |
0 |
77,449 |
9.03% |
54.09% |
45.06% |
0.00% |
0.85% |
464,028 |
386,579 |
0 |
7,294 |
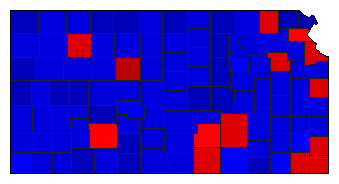
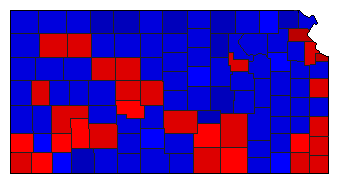
 |  | Governor |
850,414 |
2 |
1 |
0 |
32,403 |
3.81% |
47.07% |
50.88% |
0.00% |
2.06% |
400,264 |
432,667 |
0 |
17,483 |
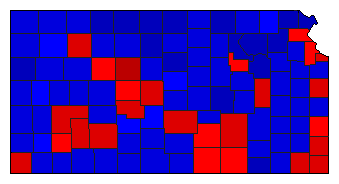
 |  | Lt. Governor |
800,294 |
2 |
1 |
0 |
35,379 |
4.42% |
46.33% |
50.75% |
0.00% |
2.92% |
370,777 |
406,156 |
0 |
23,361 |
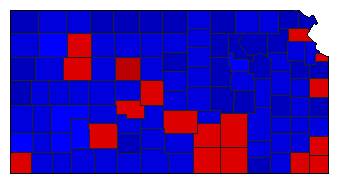
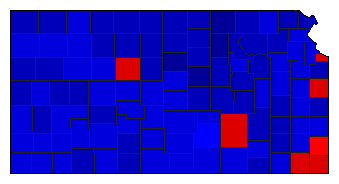 |  | Secretary of State |
789,377 |
2 |
1 |
0 |
108,018 |
13.68% |
42.17% |
55.86% |
0.00% |
1.97% |
332,915 |
440,933 |
0 |
15,529 |
 |  | State Treasurer |
777,409 |
2 |
1 |
0 |
42,632 |
5.48% |
45.35% |
50.84% |
0.00% |
3.81% |
352,567 |
395,199 |
0 |
29,643 |
 |  | Attorney General |
776,649 |
2 |
1 |
0 |
22,651 |
2.92% |
48.54% |
51.46% |
0.00% |
0.00% |
376,999 |
399,650 |
0 |
0 |
 |  | State Auditor |
774,644 |
2 |
1 |
0 |
13,125 |
1.69% |
47.31% |
49.01% |
0.00% |
3.68% |
366,496 |
379,621 |
0 |
28,527 |
 |  | Insurance Commissioner |
773,539 |
2 |
1 |
0 |
46,270 |
5.98% |
46.18% |
52.16% |
0.00% |
1.66% |
357,196 |
403,466 |
0 |
12,877 |
|
