| Map | Pie | Office | Total | D | R | I | Margin | %Margin | Dem | Rep | Ind | Oth. | Dem | Rep | Ind | Other | | | | | | | | | | | | | | | | | | |
|---|
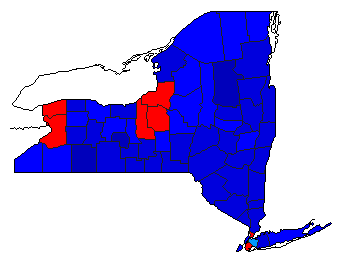 | | Governor |
6,031,482 |
2 |
1 |
4 |
392,263 |
6.50% |
38.11% |
44.61% |
8.41% |
8.87% |
2,298,363 |
2,690,626 |
507,234 |
535,259 |
 | | Attorney General |
5,716,175 |
2 |
1 |
4 |
1,028,374 |
17.99% |
35.58% |
53.57% |
4.98% |
5.86% |
2,033,981 |
3,062,355 |
284,813 |
335,026 |
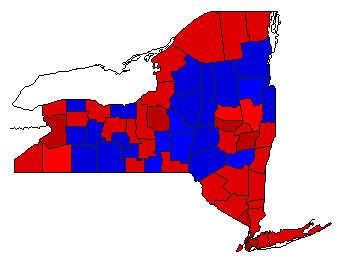 | | Comptroller General |
5,716,052 |
1 |
2 |
3 |
1,635,899 |
28.62% |
61.18% |
32.57% |
5.80% |
0.45% |
3,497,349 |
1,861,450 |
331,467 |
25,786 |
|
