Note: The Google advertisement links below may advocate political positions that this site does not endorse.
| Map | Pie | Office | Total | D | R | I | Margin | %Margin | Dem | Rep | Ind | Oth. | Dem | Rep | Ind | Other | | | | | | | | | | | | | | | | | | |
|---|
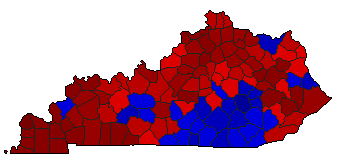
 | | Governor |
748,157 |
1 |
2 |
0 |
192,161 |
25.68% |
62.84% |
37.16% |
0.00% |
0.00% |
470,159 |
277,998 |
0 |
0 |
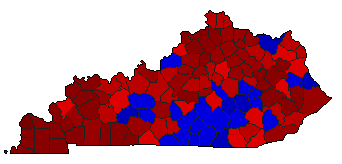
 |  | Secretary of State |
636,983 |
1 |
2 |
0 |
133,433 |
20.95% |
60.47% |
39.53% |
0.00% |
0.00% |
385,208 |
251,775 |
0 |
0 |
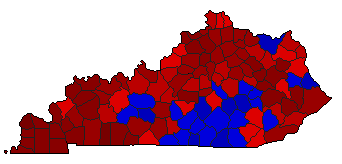
 | | State Treasurer |
626,187 |
1 |
2 |
0 |
148,159 |
23.66% |
61.83% |
38.17% |
0.00% |
0.00% |
387,173 |
239,014 |
0 |
0 |
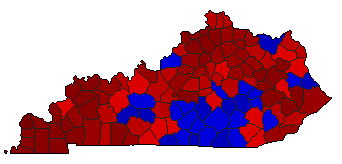
 | | Attorney General |
629,109 |
1 |
2 |
0 |
179,151 |
28.48% |
64.24% |
35.76% |
0.00% |
0.00% |
404,130 |
224,979 |
0 |
0 |
 |  | State Auditor |
621,585 |
1 |
2 |
0 |
158,247 |
25.46% |
62.73% |
37.27% |
0.00% |
0.00% |
389,916 |
231,669 |
0 |
0 |
 | | Agriculture Commissioner |
619,685 |
1 |
2 |
0 |
134,669 |
21.73% |
60.87% |
39.13% |
0.00% |
0.00% |
377,177 |
242,508 |
0 |
0 |
|
