| Map | Pie | Office | Total | D | R | I | Margin | %Margin | Dem | Rep | Ind | Oth. | Dem | Rep | Ind | Other | | | | | | | | | | | | | | | | | | |
|---|
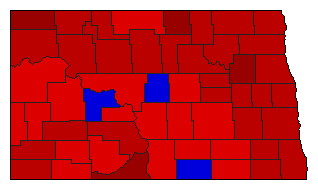
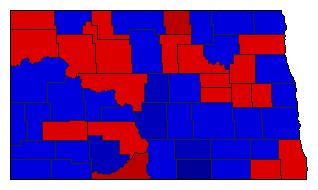
 |  | President |
297,094 |
2 |
1 |
- |
17,392 |
5.85% |
45.80% |
51.66% |
0.00% |
2.54% |
136,078 |
153,470 |
0 |
7,546 |
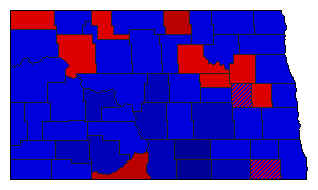
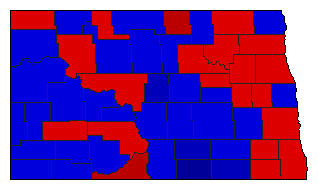
 |  | Senator |
283,062 |
1 |
2 |
0 |
72,306 |
25.54% |
62.10% |
36.55% |
0.00% |
1.35% |
175,772 |
103,466 |
0 |
3,824 |
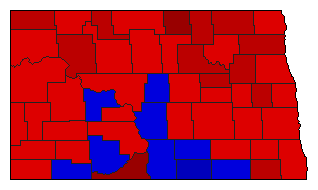
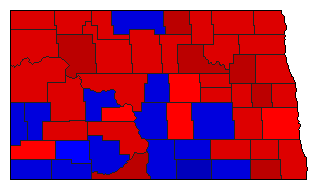 | | Governor |
297,249 |
1 |
2 |
3 |
14,988 |
5.04% |
51.58% |
46.53% |
1.89% |
0.00% |
153,309 |
138,321 |
5,619 |
0 |
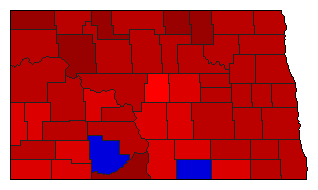
 |  | Secretary of State |
270,931 |
2 |
1 |
0 |
30,797 |
11.37% |
44.32% |
55.68% |
0.00% |
0.00% |
120,067 |
150,864 |
0 |
0 |
 |  | State Treasurer |
269,512 |
1 |
2 |
0 |
40,916 |
15.18% |
57.59% |
42.41% |
0.00% |
0.00% |
155,214 |
114,298 |
0 |
0 |
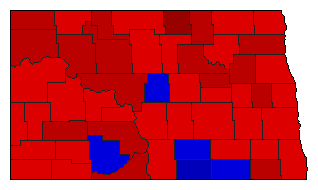
 |  | Attorney General |
274,298 |
2 |
1 |
0 |
9,698 |
3.54% |
48.23% |
51.77% |
0.00% |
0.00% |
132,300 |
141,998 |
0 |
0 |
 |  | State Auditor |
265,727 |
2 |
1 |
0 |
3,999 |
1.50% |
49.25% |
50.75% |
0.00% |
0.00% |
130,864 |
134,863 |
0 |
0 |
 |  | Insurance Commissioner |
267,798 |
1 |
2 |
0 |
26,084 |
9.74% |
54.87% |
45.13% |
0.00% |
0.00% |
146,941 |
120,857 |
0 |
0 |
 |  | Agriculture Commissioner |
271,033 |
1 |
2 |
0 |
75,042 |
27.69% |
63.28% |
35.59% |
0.00% |
1.13% |
171,503 |
96,461 |
0 |
3,069 |
|
