Note: The Google advertisement links below may advocate political positions that this site does not endorse.
| Map | Pie | Office | Total | D | R | I | Margin | %Margin | Dem | Rep | Ind | Oth. | Dem | Rep | Ind | Other | | | | | | | | | | | | | | | | | | |
|---|
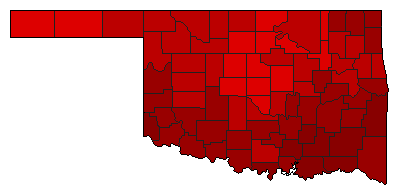 | | Governor |
883,130 |
1 |
2 |
0 |
215,952 |
24.45% |
62.07% |
37.62% |
0.00% |
0.31% |
548,159 |
332,207 |
0 |
2,764 |
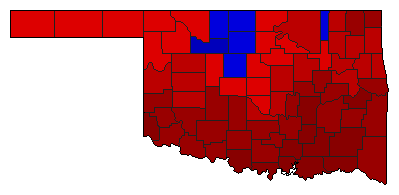 | | Lt. Governor |
834,037 |
1 |
2 |
0 |
191,507 |
22.96% |
61.48% |
38.52% |
0.00% |
0.00% |
512,772 |
321,265 |
0 |
0 |
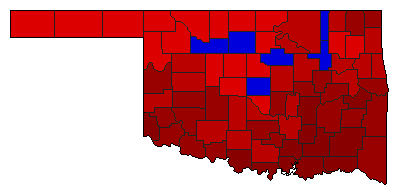
 | | State Treasurer |
834,519 |
1 |
2 |
3 |
190,428 |
22.82% |
60.53% |
37.71% |
1.75% |
0.00% |
505,160 |
314,732 |
14,627 |
0 |
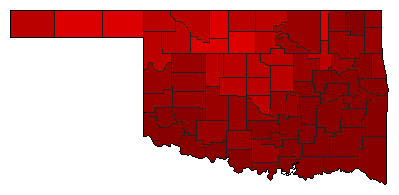 | | Attorney General |
815,357 |
1 |
2 |
0 |
358,139 |
43.92% |
71.96% |
28.04% |
0.00% |
0.00% |
586,748 |
228,609 |
0 |
0 |
 | | State Auditor |
796,590 |
1 |
2 |
0 |
134,558 |
16.89% |
58.45% |
41.55% |
0.00% |
0.00% |
465,574 |
331,016 |
0 |
0 |
|
