| Map | Pie | Office | Total | D | R | I | Margin | %Margin | Dem | Rep | Ind | Oth. | Dem | Rep | Ind | Other | | | | | | | | | | | | | | | | | | |
|---|
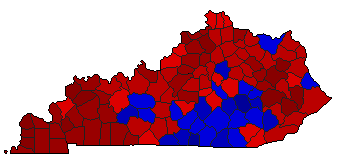
 | | Governor |
1,030,671 |
1 |
2 |
0 |
107,024 |
10.38% |
54.50% |
44.11% |
0.00% |
1.39% |
561,674 |
454,650 |
0 |
14,347 |
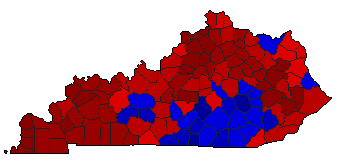
 | | Lt. Governor |
897,949 |
1 |
2 |
0 |
247,517 |
27.56% |
63.35% |
35.79% |
0.00% |
0.86% |
568,869 |
321,352 |
0 |
7,728 |
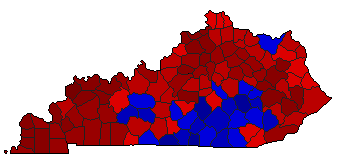
 | | Secretary of State |
795,694 |
1 |
2 |
0 |
153,702 |
19.32% |
59.66% |
40.34% |
0.00% |
0.00% |
474,698 |
320,996 |
0 |
0 |
 | | State Treasurer |
811,048 |
1 |
2 |
0 |
162,930 |
20.09% |
60.04% |
39.96% |
0.00% |
0.00% |
486,989 |
324,059 |
0 |
0 |
 | | Attorney General |
823,765 |
1 |
2 |
0 |
287,669 |
34.92% |
67.46% |
32.54% |
0.00% |
0.00% |
555,717 |
268,048 |
0 |
0 |
 |  | State Auditor |
784,285 |
1 |
2 |
0 |
223,623 |
28.51% |
64.26% |
35.74% |
0.00% |
0.00% |
503,954 |
280,331 |
0 |
0 |
 | | Agriculture Commissioner |
784,021 |
1 |
2 |
0 |
216,229 |
27.58% |
63.79% |
36.21% |
0.00% |
0.00% |
500,125 |
283,896 |
0 |
0 |
|
