| Map | Pie | Office | Total | D | R | I | Margin | %Margin | Dem | Rep | Ind | Oth. | Dem | Rep | Ind | Other | | | | | | | | | | | | | | | | | | |
|---|
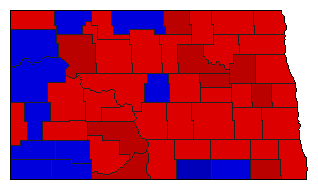
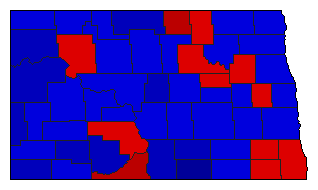
 |  | President |
308,971 |
2 |
1 |
- |
95,907 |
31.04% |
33.80% |
64.84% |
0.00% |
1.36% |
104,429 |
200,336 |
0 |
4,206 |
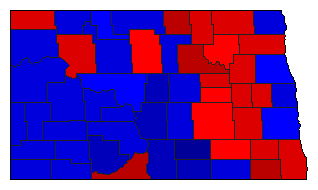
 | | Governor |
314,382 |
1 |
2 |
0 |
33,462 |
10.64% |
55.32% |
44.68% |
0.00% |
0.00% |
173,922 |
140,460 |
0 |
0 |
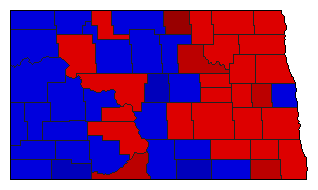
 |  | Secretary of State |
303,890 |
2 |
1 |
3 |
14,474 |
4.76% |
46.13% |
50.90% |
2.97% |
0.00% |
140,191 |
154,665 |
9,034 |
0 |
 |  | State Treasurer |
296,526 |
1 |
2 |
0 |
2,852 |
0.96% |
50.48% |
49.52% |
0.00% |
0.00% |
149,689 |
146,837 |
0 |
0 |
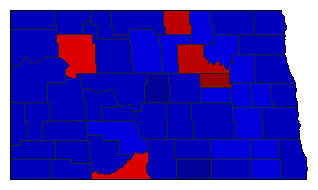
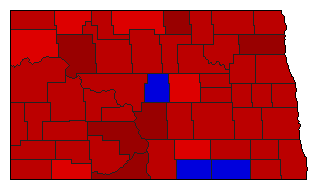 |  | Attorney General |
307,922 |
1 |
2 |
0 |
93,540 |
30.38% |
65.19% |
34.81% |
0.00% |
0.00% |
200,731 |
107,191 |
0 |
0 |
 |  | State Auditor |
299,478 |
2 |
1 |
0 |
24,338 |
8.13% |
45.94% |
54.06% |
0.00% |
0.00% |
137,570 |
161,908 |
0 |
0 |
 |  | Insurance Commissioner |
301,073 |
1 |
2 |
3 |
24,389 |
8.10% |
52.33% |
44.23% |
3.45% |
0.00% |
157,542 |
133,153 |
10,378 |
0 |
 |  | Agriculture Commissioner |
300,364 |
2 |
1 |
0 |
66,188 |
22.04% |
38.98% |
61.02% |
0.00% |
0.00% |
117,088 |
183,276 |
0 |
0 |
|
