| Map | Pie | Office | Total | D | R | I | Margin | %Margin | Dem | Rep | Ind | Oth. | Dem | Rep | Ind | Other | | | | | | | | | | | | | | | | | | |
|---|
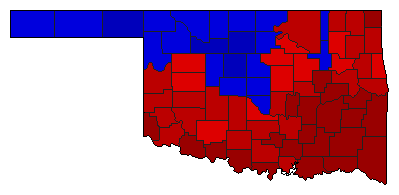
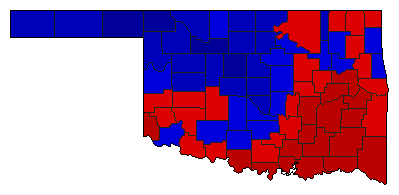 | | Senator |
893,666 |
2 |
1 |
0 |
93,206 |
10.43% |
44.79% |
55.21% |
0.00% |
0.00% |
400,230 |
493,436 |
0 |
0 |
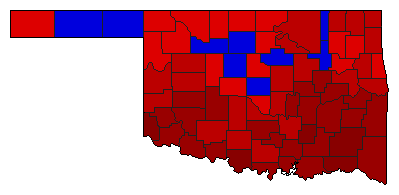
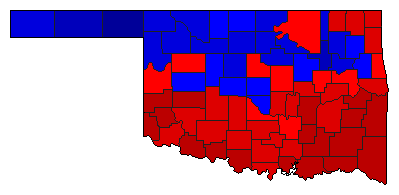 | | Governor |
909,925 |
2 |
1 |
3 |
26,467 |
2.91% |
44.54% |
47.45% |
6.61% |
1.40% |
405,295 |
431,762 |
60,115 |
12,753 |
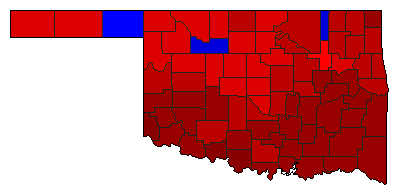
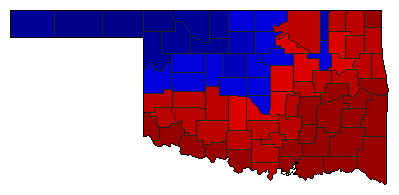 | | Lt. Governor |
895,321 |
1 |
2 |
0 |
44,241 |
4.94% |
52.47% |
47.53% |
0.00% |
0.00% |
469,781 |
425,540 |
0 |
0 |
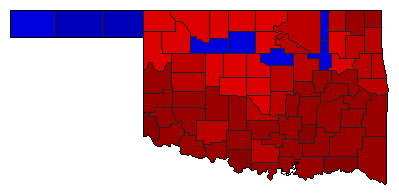 | | State Treasurer |
867,752 |
1 |
2 |
0 |
171,958 |
19.82% |
59.91% |
40.09% |
0.00% |
0.00% |
519,855 |
347,897 |
0 |
0 |
 | | Attorney General |
879,821 |
1 |
2 |
0 |
80,533 |
9.15% |
54.58% |
45.42% |
0.00% |
0.00% |
480,177 |
399,644 |
0 |
0 |
 | | State Auditor |
855,733 |
1 |
2 |
0 |
129,369 |
15.12% |
57.56% |
42.44% |
0.00% |
0.00% |
492,551 |
363,182 |
0 |
0 |
 | | Insurance Commissioner |
868,303 |
1 |
2 |
3 |
228,306 |
26.29% |
60.80% |
34.50% |
4.70% |
0.00% |
527,907 |
299,601 |
40,795 |
0 |
|
