| Map | Pie | Office | Total | D | R | I | Margin | %Margin | Dem | Rep | Ind | Oth. | Dem | Rep | Ind | Other | | | | | | | | | | | | | | | | | | |
|---|
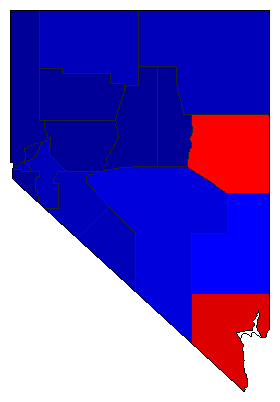
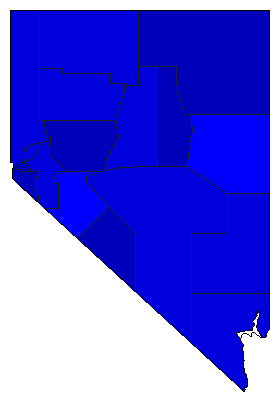
 |  | Governor |
320,743 |
1 |
2 |
0 |
112,089 |
34.95% |
64.81% |
29.86% |
0.00% |
5.32% |
207,878 |
95,789 |
0 |
17,076 |
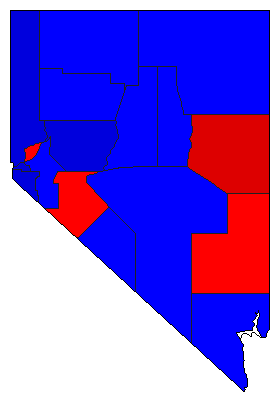
 |  | Lt. Governor |
317,494 |
2 |
1 |
3 |
49,373 |
15.55% |
39.02% |
54.57% |
6.41% |
0.00% |
123,889 |
173,262 |
20,343 |
0 |
 |  | Secretary of State |
315,470 |
2 |
1 |
3 |
29,478 |
9.34% |
39.57% |
48.91% |
6.97% |
4.55% |
124,824 |
154,302 |
21,997 |
14,347 |
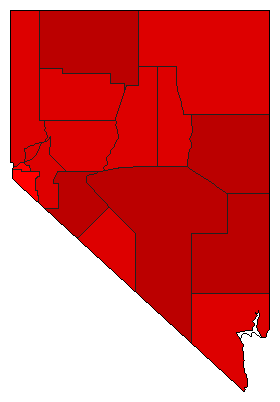
 |  | State Treasurer |
315,526 |
2 |
1 |
3 |
89,898 |
28.49% |
30.82% |
59.31% |
6.09% |
3.77% |
97,252 |
187,150 |
19,222 |
11,902 |
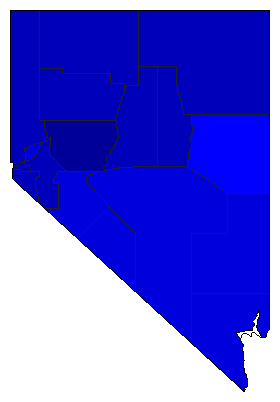
 |  | Attorney General |
318,680 |
1 |
2 |
4 |
59,574 |
18.69% |
55.83% |
37.14% |
3.20% |
3.83% |
177,919 |
118,345 |
10,209 |
12,207 |
 |  | Controller |
304,124 |
0 |
1 |
2 |
116,021 |
38.15% |
0.00% |
59.14% |
20.99% |
19.87% |
0 |
179,856 |
63,835 |
60,433 |
|
